Ozone can be good or bad for health and the environment depending on where it’s found in the atmosphere. Good ozone is stratospheric. It protects living things from ultraviolet radiation from the sun. Bad ozone is ground-level. It can trigger a variety of health concerns, particularly for children, elderly and individuals with lung diseases such as asthma.
Overview
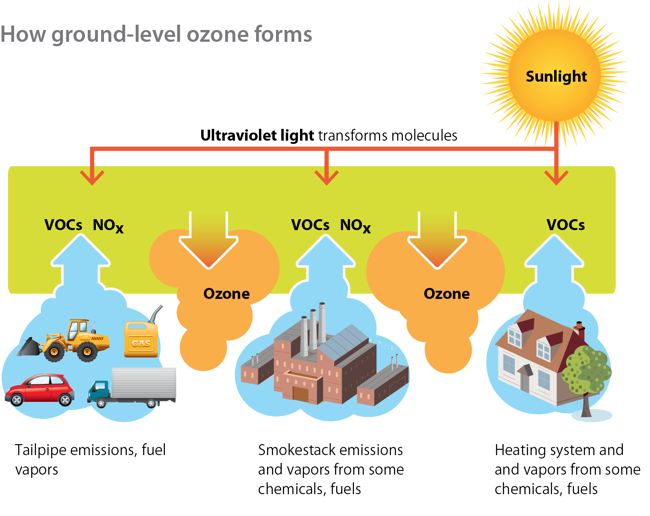
Ozone is a gas composed of three atoms of oxygen in each molecule. Ozone in the upper atmosphere, or stratospheric ozone, occurs naturally and forms a protective layer that helps to shield us from the sun's harmful ultraviolet rays. Ozone near ground level, or tropospheric ozone, is a harmful air pollutant, and it is one of the main ingredients in photochemical smog. Ground level ozone is not emitted directly into the air, but is created by chemical reactions involving oxides of nitrogen, volatile organic compounds, and oxygen, with energy for the reactions provided by sunlight. The precursor pollutants that enter these reactions are emitted by cars, power plants, industrial boilers, refineries, chemical plants and other sources. The picture illustrates some of these sources and the complex reactions that form photochemical smog, including ground level ozone.
Health Effects of Ozone
Exposure to ground-level ozone can contribute to health and environmental problems. Ozone can irritate the eyes, nose and throat, and can aggravate asthma and other lung diseases, including bronchitis. Ozone can trigger a variety of health problems. Those most susceptible to ozone include children, the elderly and individuals with pre-existing respiratory problems. Children, whose lungs are still forming and many of whom spend a large amount of time outdoors, are at particular risk under high ozone concentrations.
Air Quality Standards and Monitoring
Ozone is one of the six common air pollutants identified in the Clean Air Act. EPA calls these “criteria air pollutants” because their levels in outdoor air need to be limited based on health criteria. The primary National Ambient Air Quality Standard for ozone is 0.070 parts per million averaged over eight hours (annual fourth-highest daily maximum 8-hour concentration, averaged over three years).
Missouri monitors ozone concentrations in the air at several locations across the state. Most of these monitoring sites are operated during March through October, because ozone formation in the air is more likely in the summer months. Click on the Monitoring tab to learn more about these air monitoring sites. Click on the Data tab to learn more about the data collected from this sites.
More information is available on EPA's Ozone webpage.
Data
Ozone Monitoring Network
Contact Information
Air Pollution Control Program
Division of Environmental Quality
P.O. Box 176
Jefferson City, MO 65102-0176
United States