Missouri has been working to improve its air quality since the passage of the smoke ordinance in St. Louis City in 1937. Today, most areas of Missouri meet the National Ambient Air Quality Standards (NAAQS) with the exception of the ozone standard in some areas of the St. Louis metropolitan area and a few other localized areas for lead and sulfur dioxide. For more information about the pollutants with national emission standards, visit Air Pollutants and Sources.
When an area does not meet air quality standards, the Missouri Department of Natural Resources develops a plan to address emissions that contribute to poor air quality. The long-term trends in emissions and air pollutants continue to decrease thanks to planning efforts as well as support from industry and citizens. For more information about these plans, visit State Planning.
Tracking Pollutant Emissions
Tracking the amount of pollutant emissions by regulated facilities is one way Missouri monitors improvements in air quality. Air emissions are created by a wide variety of sources. Each source emits different air pollutants at different rates. For more information, visit Air Emissions.
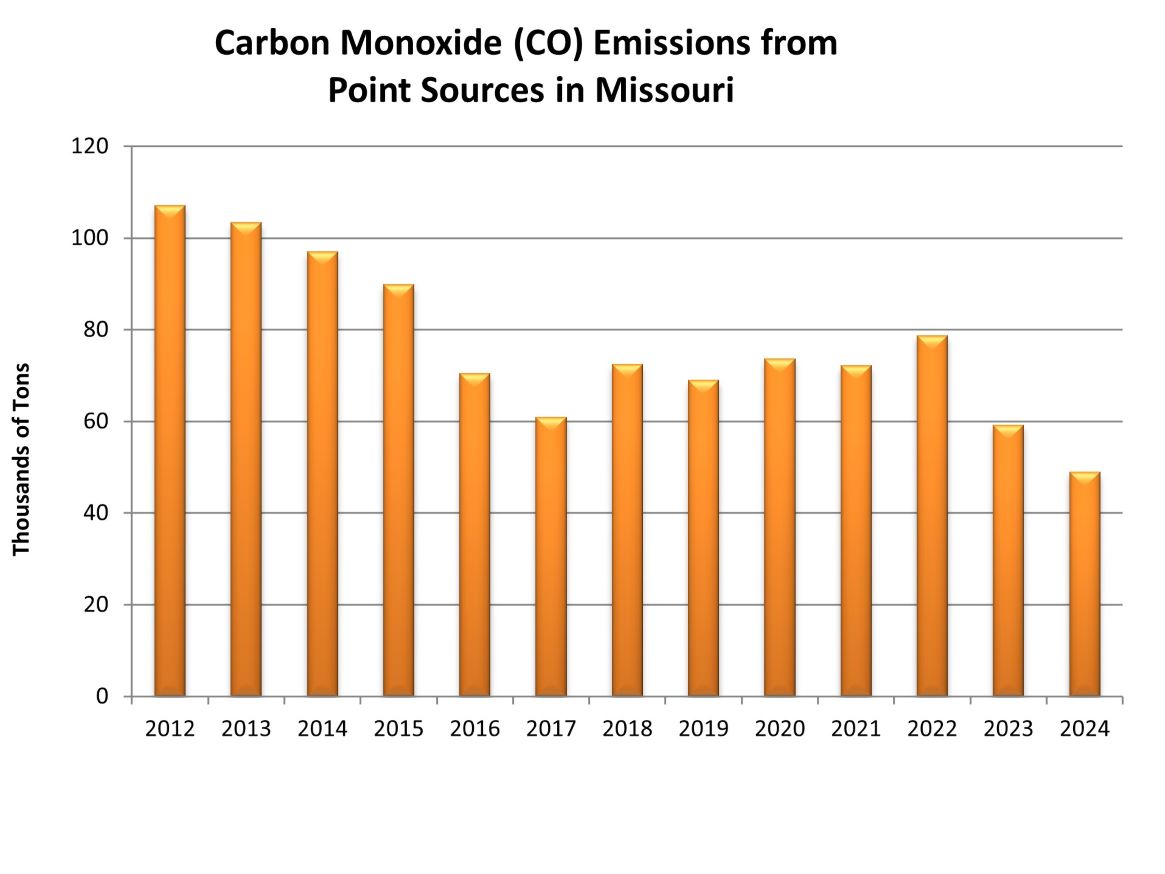
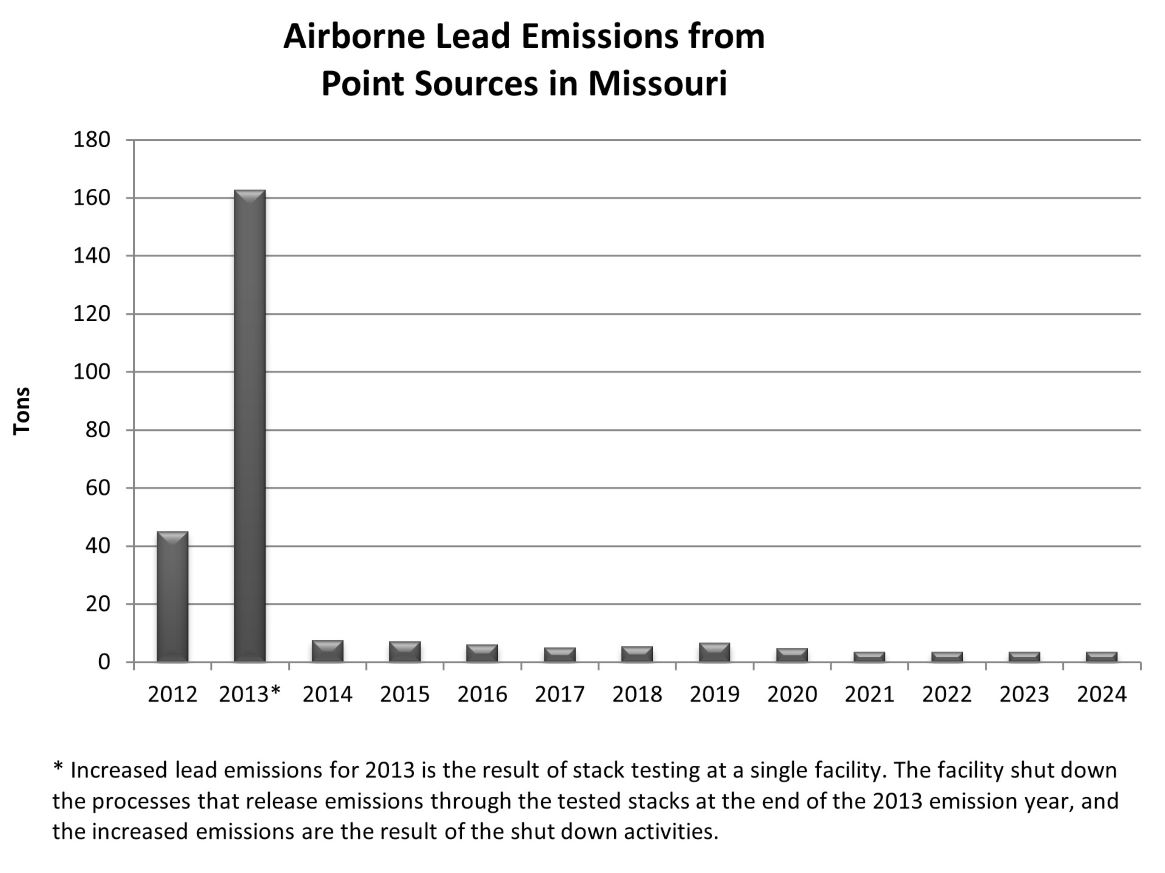
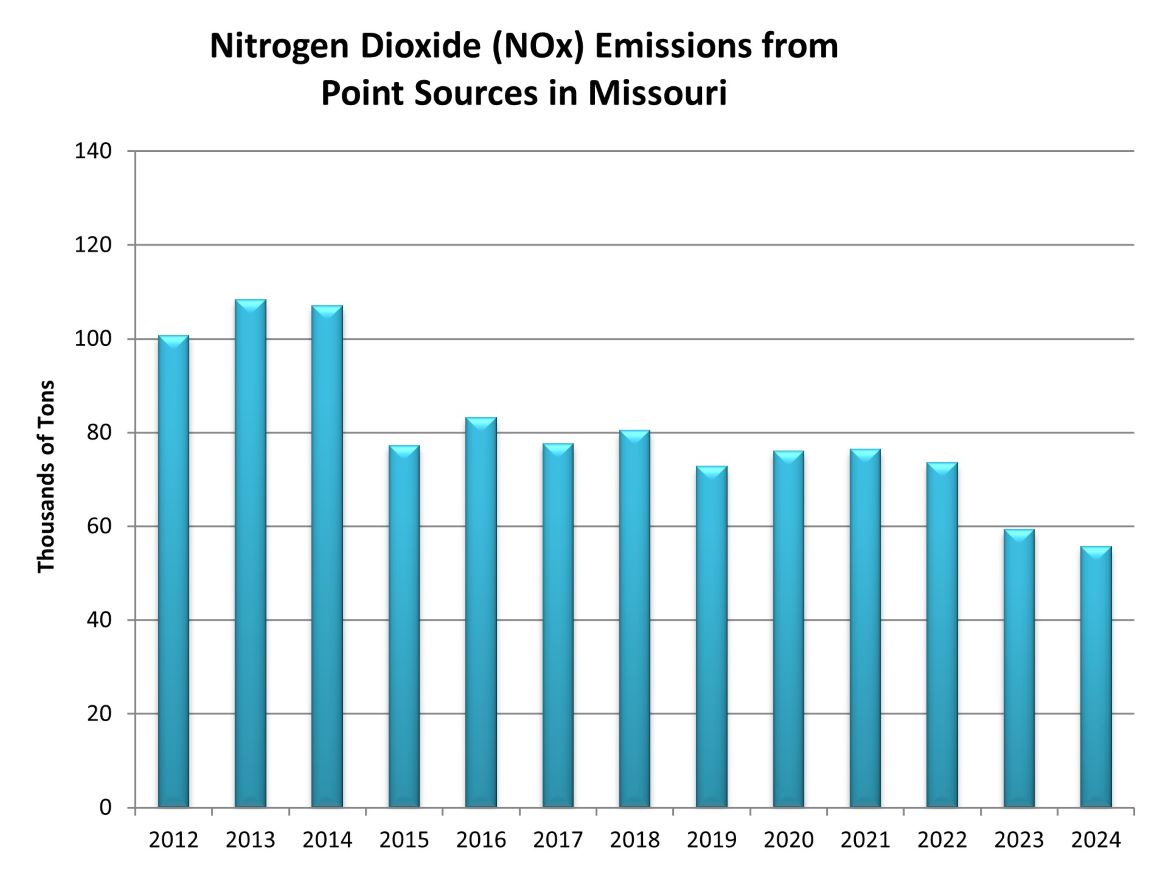
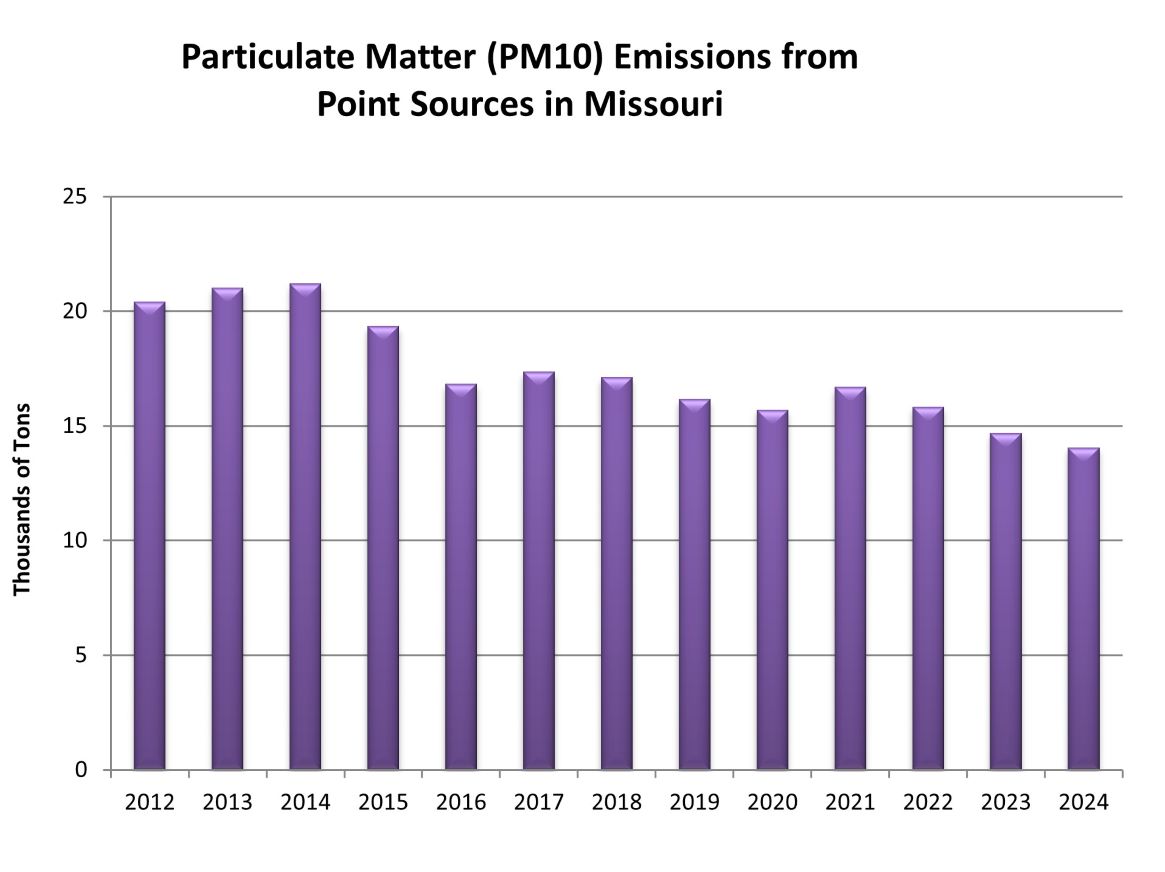
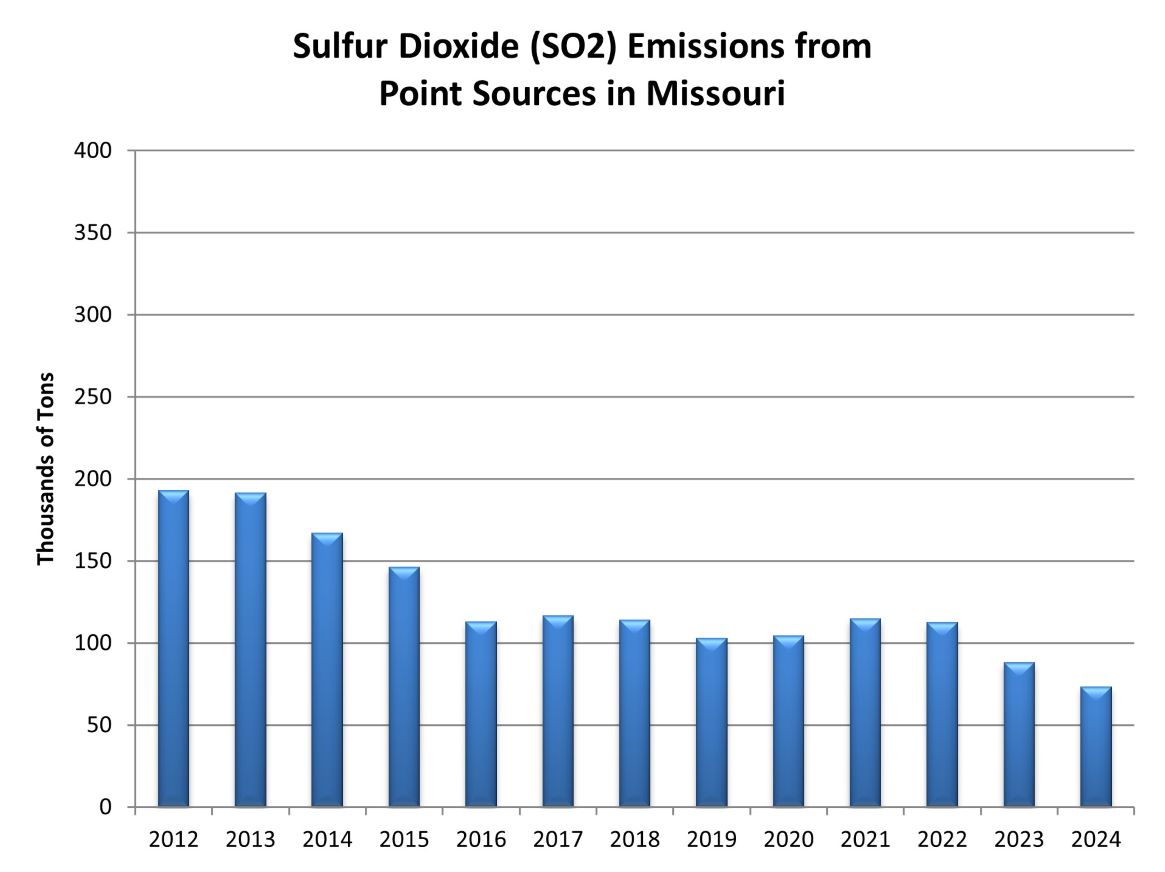
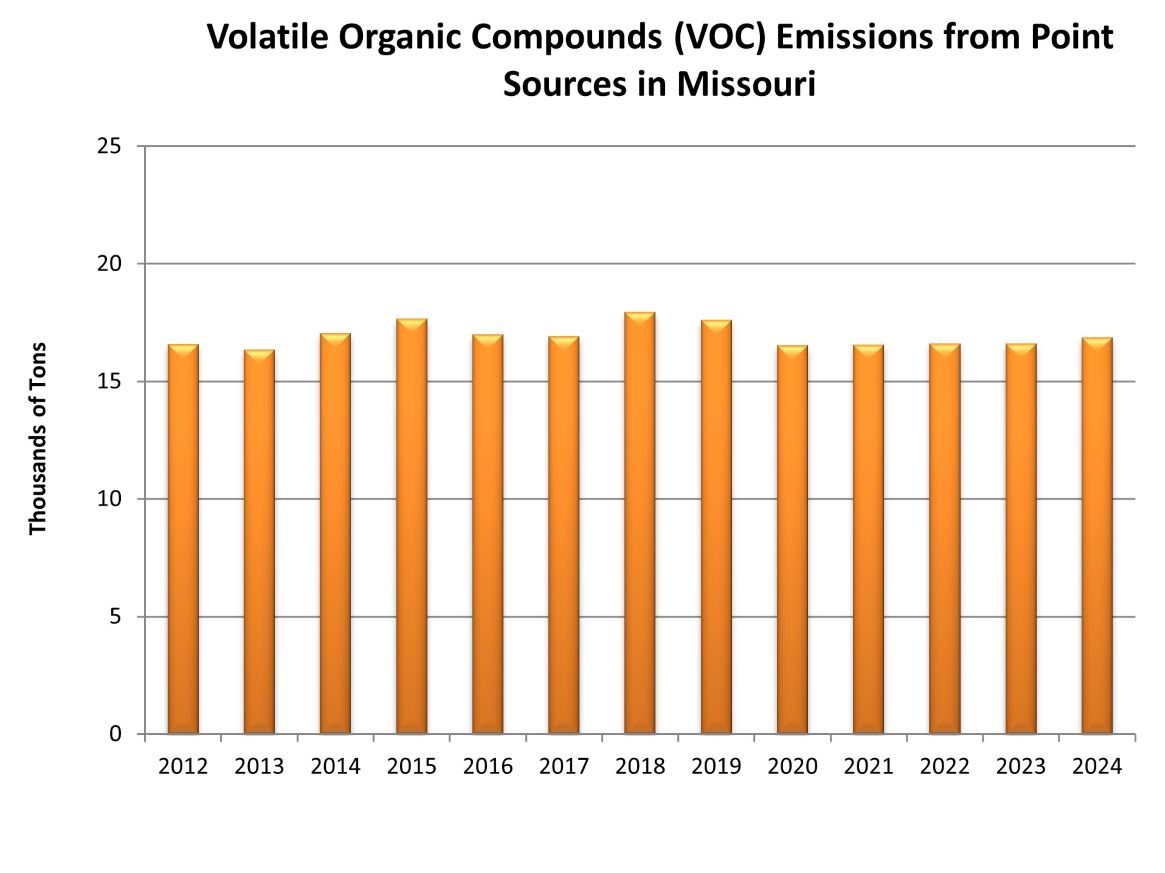
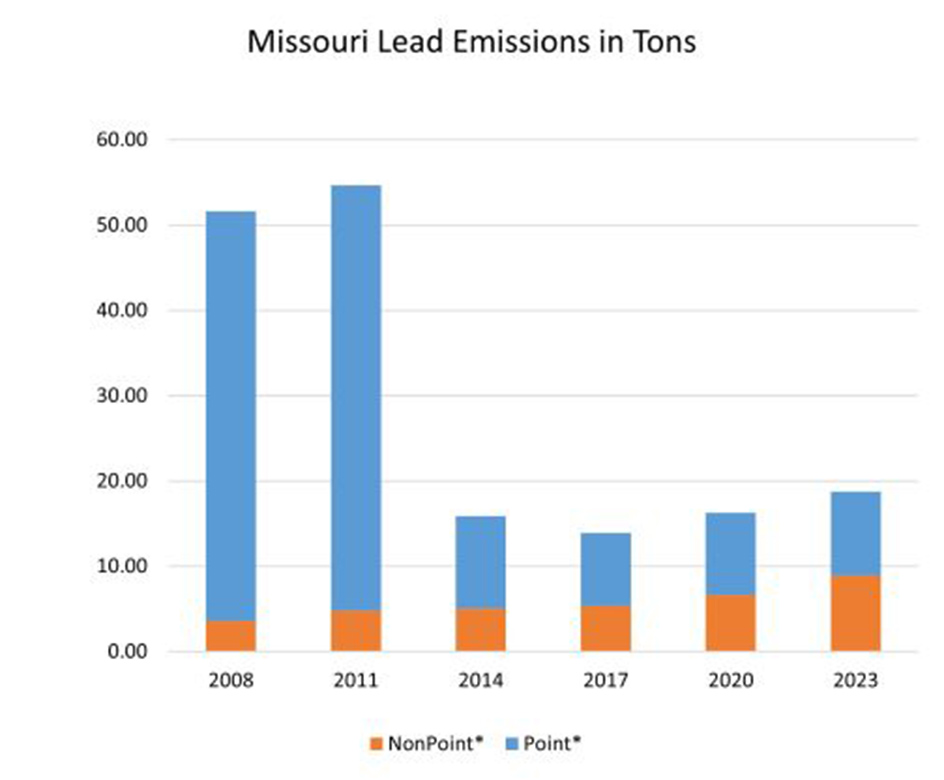
Point Sources Emissions Reported by Regulated Facilities
The following charts track some emissions reported by large point sources such as power plants and industrial sources.
Click a chart/ image to enlarge.
Emissions from power plants and industrial sources are only part of the story. Other emission categories include mobile sources, such as cars and trucks, and nonpoint sources like residential and light commercial fuel combustion. In urban areas, the total emissions from the mobile sources is greater than point sources for some pollutants.
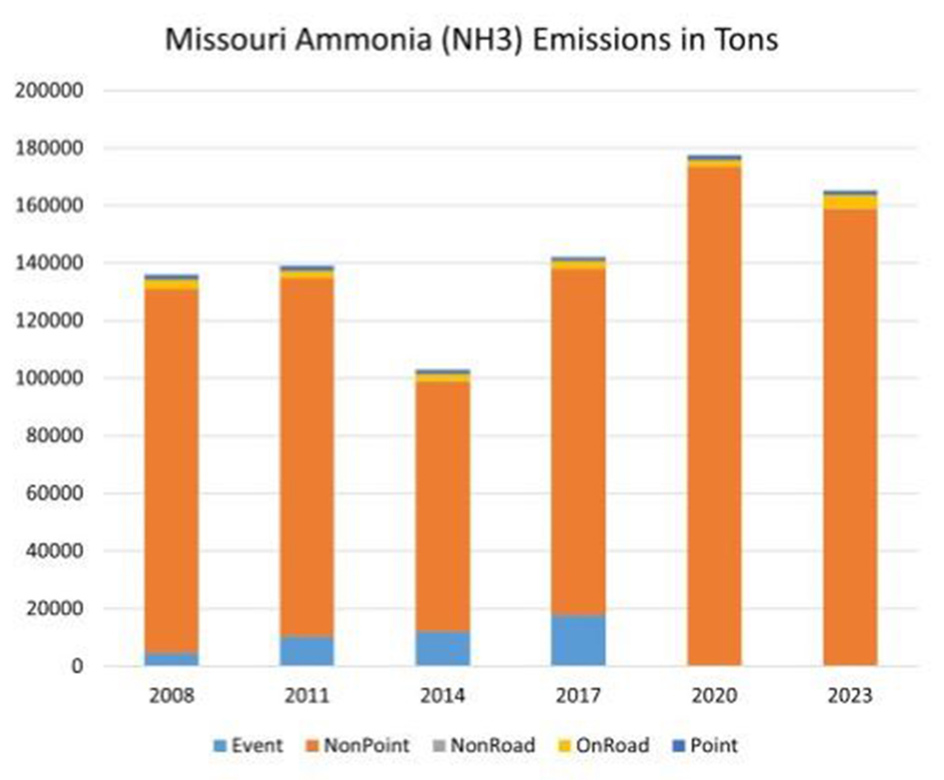
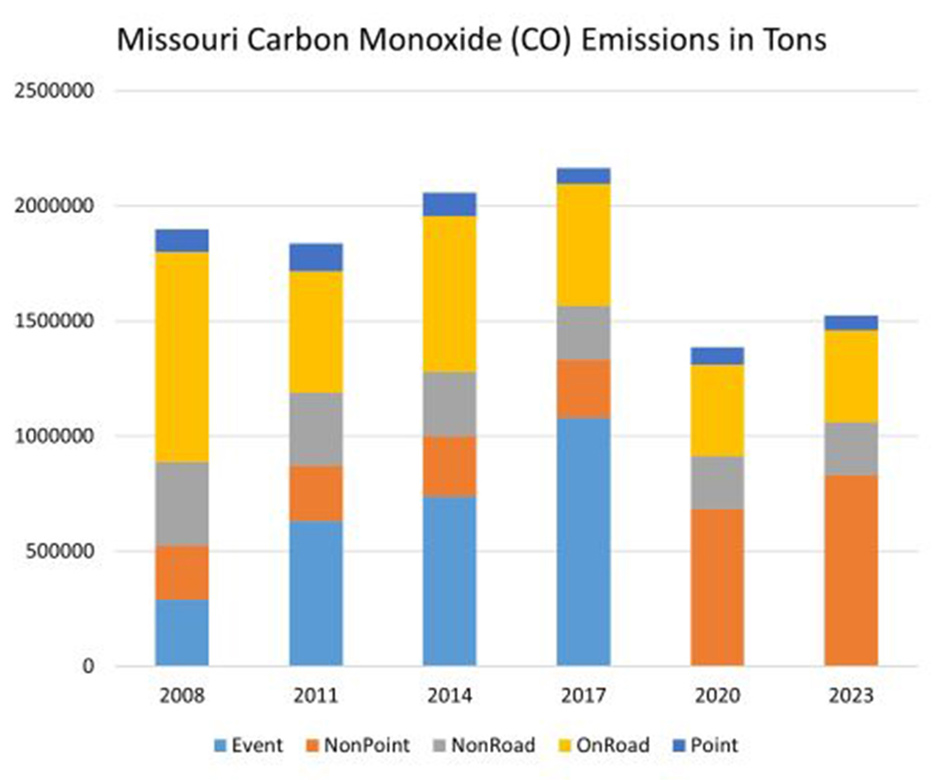
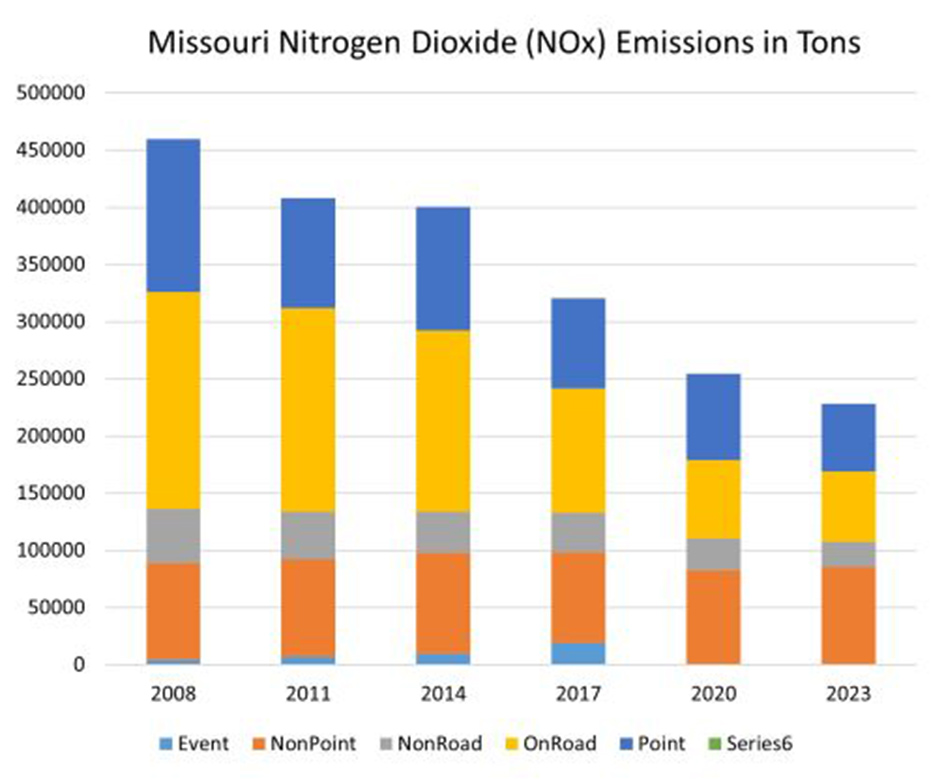
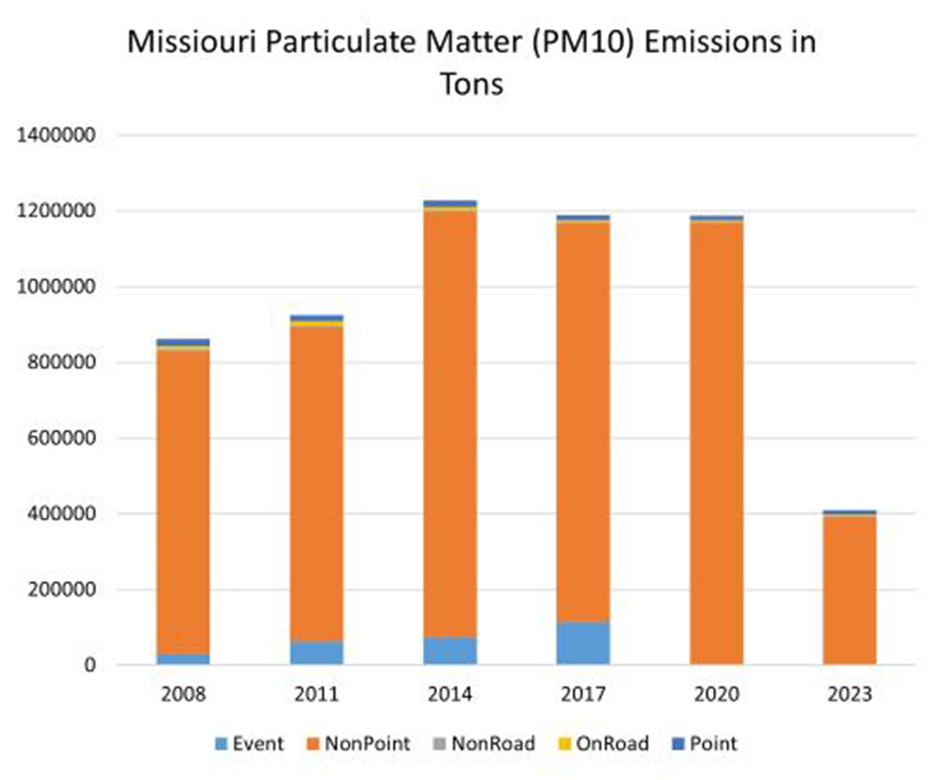
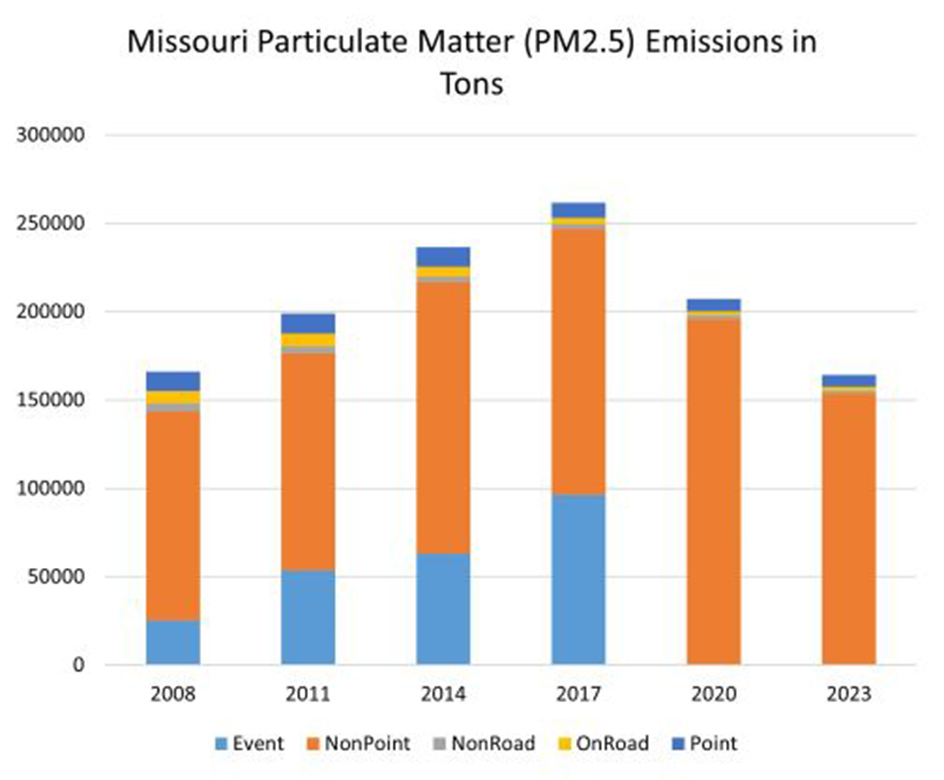
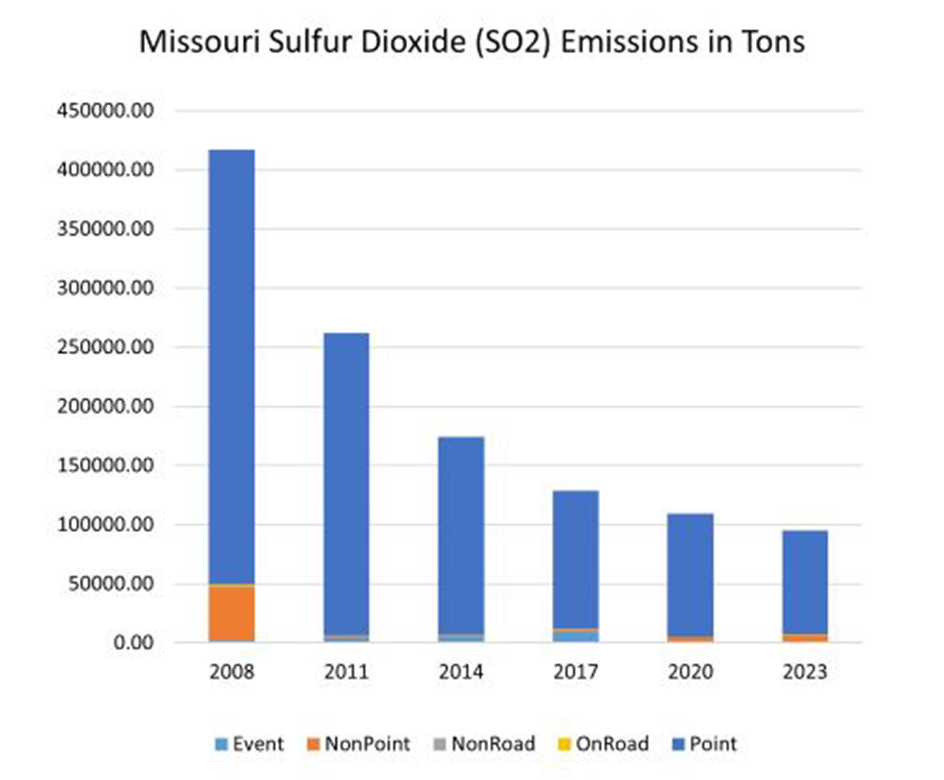
National Emissions Inventory from All Sources
The following charts group the total statewide emissions inventory into the various emissions categories. This inventory is called the national emissions inventory and is produced on a three-year cycle due to the effort needed to compile the emissions data estimates from all source categories. The charts below are updated every three years, after the U.S. Environmental Protection Agency (EPA) releases the final version of the National Emissions Inventory. From 2020 forward, Event emissions are included in the NonPoint category.
Click a chart/ image to enlarge.

Contact Information
Air Pollution Control Program
Division of Environmental Quality
P.O. Box 176
Jefferson City, MO 65102-0176
United States