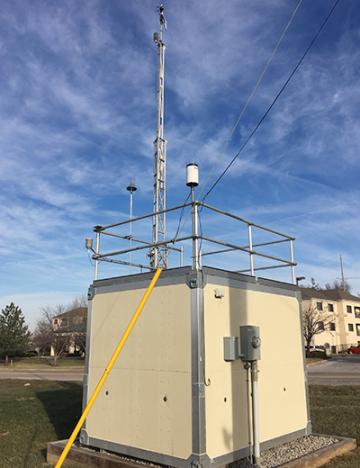
The Rider Trail air monitoring station is located off Interstate 70 at Exit 231B in Earth City. This is the second air monitoring station in the St. Louis area to provide near-road data. The department began monitoring SO2 at the site in May 2016. Preliminary data show that the site is in compliance with the one-hour NO2 standard and one-hour SO2 standard. Both pollutants negatively affect respiration.
To learn about other air monitoring sites the department operates as part of the state's ambient air monitoring network, visit Air Monitoring Sites.
Pollutants
Nitrogen Dioxide
In 2010, EPA revised the one-hour NO2 standard. The primary National Ambient Air Quality Standard (NAAQS), based on health effects, for NO2 is 100 parts per billion (ppb) averaged over one hour. The one-hour standard is based on a three-year design value, which is calculated by taking the 98th percentile of the one-hour daily maximum concentrations recorded each year, and averaging three years together. The annual standard of 0.053 parts per million (ppm) – or 53 ppb – is based on the annual arithmetic mean and is not to be exceeded. An area is in compliance if the design value is at or below the standard.
*All times listed in reports reflect Central Standard Time (CST).
- One-hour NO2 design values
- Eight highest one-hour NO2 values, year-to-date
- Map of Missouri's NO2 monitoring sites
- Additional information about Nitrogen Dioxide State Planning efforts
Technical issues can affect ability to deliver quality data. Access a table of symbols with explanation of the problems they represent.
- NO2 data in the fifth column
- Data from past 10 days through current date
Sulfur Dioxide
In 2010, EPA not only established a new one-hour standard, but also introduced a new form for determining compliance. The primary National Ambient Air Quality Standard (NAAQS), based on health effects, for SO2 is 75 parts per billion (ppb) averaged over one hour. The new form requires three years of data — the average SO2 concentration from each hour of the year. The department and EPA calculate the design value, using the 99th percentile of one-hour daily maximum concentrations, averaged over three years.
*All times listed in reports reflect Central Standard Time (CST).
- One-hour SO2 design values
- Four highest one-hour SO2 values year-to-date
- Map of Missouri's SO2 monitoring sites
Additional information about Sulfur Dioxide State Planning efforts
Technical issues can affect ability to deliver quality data. Access a table of symbols with explanation of the problems they represent.
- SO2 data in third column
- Data from past 10 days through current date
13080 Hollenberg Drive
Bridgeton, MO 63044
United States
Air Pollution Control Program
Division of Environmental Quality
P.O. Box 176
Jefferson City, MO 65102-0176
United States