
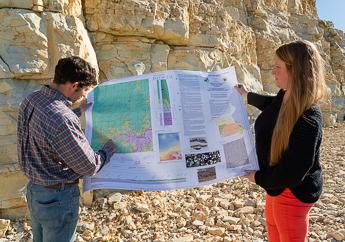
Geologic Map Day is celebrated the Friday of Earth Science Week. Geologic Map Day is a special event to promote awareness and the vital importance of geologic mapping. Geologic Map Day focuses on the creation, study, uses and importance of geologic mapping for education, science, business and a variety of public policy concerns. Students, teachers and the general public are encouraged to take part in public outreach opportunities and learn through educational activities, print materials and online resources.
The department’s Missouri Geological Survey has been creating and archiving geologic maps of Missouri for more than 160 years. Geologic maps provide information about the Earth’s structure and provide a baseline for data related to energy resources, mineral resources, natural hazards, water resources, soil conservation and climate science. They show the rock type, distribution, properties and its relative age. Virtually all mineral, energy, water, industrial construction, public works and urban development projects can benefit from a geologic map.
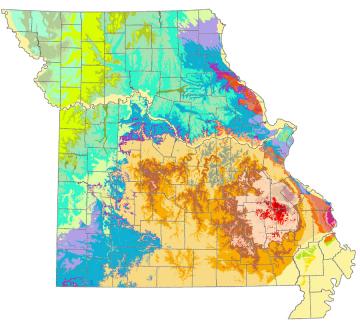
Bedrock geologic maps provide information about the existing layering of bedrock and faulting, folding or deformation. They include information about the distribution of rock such as limestone, sandstone, coal and granite. Surficial material maps describe deposits that occur above bedrock. This includes soil, but also details up to several hundred feet of deeper unconsolidated material. Visit our Ed Clark Museum of Missouri Geology to learn more about geologic maps.
Download these Missouri geologic maps to learn more about the diverse geology in the state.
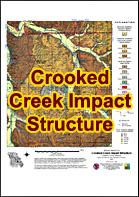
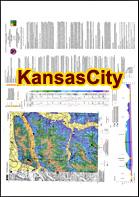
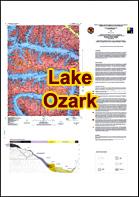

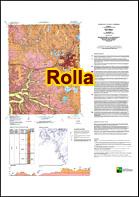
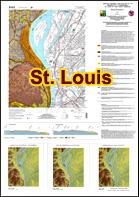
These maps and others can be purchased by visiting us at 111 Fairgrounds Road in Rolla, or by calling us. Low resolution images of many may be viewed by visiting the Geologic Map Index.
What is a geologic map?
Like all maps, a geologic map shows where things are. But while other maps highlight where you can find things like streets and streams, a geologic map shows the distribution, nature, and age relationships of rocks, faults, strata, and other geologic features.
How do you read a geologic map?
Each geologic map has a map key, which is a table explaining the meanings of all colors and symbols used to represent geologic features in the map. For example, geologic units usually are listed in order from the youngest (most recently formed) rock types to the oldest (formed earliest in time). The key often will give the name of the each unit, as well as the age and a brief description of that unit’s rocks.
In addition to units, the key usually explains the map’s use of lines and symbols. Lines might show where two units meet and perhaps bend, fold, and warp up against one another. Symbols might indicate where you can find things like fossils, precious metals, or active faults.
A strike and dip symbol, for instance, is a T-shaped symbol that shows where layers of rock stack up in tilted beds. The number accompanying a strike and dip symbol indicates the angle, or tilt, of the rock bed.
How do you use a geologic map?
Like people all over the world, your life is shaped by the geology of your area. Is the ground good for building or farming? Are you likely to find available groundwater? What natural resources are there underground? What is the likelihood of a natural disaster such as an active volcano or earthquake?
Geologic maps are used to identify many features and phenomena, from coal resources and potential landslides to vital ecosystems and animal habitats. Geologic maps are necessary to help us navigate among the many challenges and opportunities offered by the dynamic Earth systems that surround us.
(Adapted from Geologic Maps, USGS, and Meeting Challenges With Geologic Maps, AGI.)