
The Forest Park air monitoring station is located next to Interstate 64 in St. Louis and began operation in January 2013. This monitor was selected as the first near-road air monitoring site in St. Louis based analyzing traffic count data and evaluating sites that could meet air monitoring siting criteria. Near-road monitoring in the St. Louis area is required by the 2010 rule revising the NO2 standard and the 2011 rule continuing the CO standard, because motor vehicles are significant sources of NO2 and CO emissions. Airborne particulate matter (PM10 and PM2.5) and black carbon are also measured and reported hourly at the Forest Park Site.
To learn about other air monitoring sites the department operates as part of the state's ambient air monitoring network, visit Air Monitoring Sites.
Pollutants
Carbon Monoxide
Since 1971, EPA has maintained two standards for carbon monoxide: 35 parts per million (ppm) averaged over one hour and 9 ppm averaged over eight hours - not to be exceeded more than once per year. If design values are at or below the standard, then an area is in compliance. Design values correspond to an annual average of eight-hour concentrations and one-hour concentrations.
*All times listed in reports reflect Central Standard Time (CST).
- Additional information about Carbon Monoxide State Planning efforts
Technical issues can affect ability to deliver quality data. Access a table of symbols with explanation of the problems they represent.
- CO data on first page, fifth column
- Data from past 10 days through current date
Nitrogen Dioxide
In 2010, EPA revised the one-hour NO2 standard. The primary National Ambient Air Quality Standard (NAAQS), based on health effects, for NO2 is 100 parts per billion (ppb) averaged over one hour. The one-hour standard is based on a three-year design value, which is calculated by taking the 98th percentile of the one-hour daily maximum concentrations recorded each year, and averaging three years together. The annual standard of 0.053 parts per million (ppm) – or 53 ppb – is based on the annual arithmetic mean and is not to be exceeded. An area is in compliance if the design value is at or below the standard.
*All times listed in reports reflect Central Standard Time (CST).
- One-hour NO2 design values
- Eight highest one-hour NO2 values, year-to-date
- Map of Missouri's NO2 monitoring sites
- Additional information about Nitrogen Dioxide State Planning efforts
Technical issues can affect ability to deliver quality data. Access a table of symbols with explanation of the problems they represent.
- NO2 data on first page, third column
- Data on all nitrous oxides (NOx) on first page, fourth column
- Data from past 10 days through current date
Fine Particulate Matter (PM 2.5)
The primary National Ambient Air Quality Standards (NAAQS), based on health effects, for fine particulate matter smaller than 2.5 micrometers in diameter, PM2.5, is 35 micrograms per cubic meter of air (μg/m3) averaged over 24 hours (98th percentile, averaged over three years) and 12 μg/m3 annual average (averaged over three years).
*All times listed in reports reflect Central Standard Time (CST).
- Annual PM2.5 design values
- 24-Hour PM2.5 design values
- Map of Missouri's PM2.5 monitoring sites
- Additional information about Particulate Matter State Planning efforts
Technical issues can affect ability to deliver quality data. Access a table of symbols with explanation of the problems they represent.
- PM2.5 data on second page, seventh column
- Data from past 10 days through current date
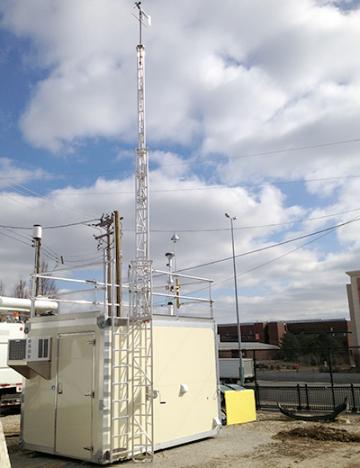
5600 Clayton Ave.
St. Louis, MO 63110
United States
Air Pollution Control Program
Division of Environmental Quality
P.O. Box 176
Jefferson City, MO 65102-0176
United States