
The Arnold West air monitoring station is located generally upwind of, but near St. Louis. This site helps to characterize air quality upwind of St. Louis. It is also used to help determine exposure to air pollutants for a portion of the population of the St. Louis Metropolitan Statistical Area and monitor attainment of the ambient air quality standards.
To learn about other air monitoring sites the department operates as part of the state's ambient air monitoring network, visit Air Monitoring Sites.
Pollutants
Ozone Pollutant
The primary National Ambient Air Quality Standard (NAAQS) for ozone is 0.070 parts per million (ppm) averaged over eight hours (annual fourth-highest daily maximum 8-hour concentration, averaged over three years). The federal ozone monitoring season runs from March 1 to Oct. 31.
*All times listed in reports reflect Central Standard Time (CST).
- Eight-hour ozone design values
- Four highest eight-hour ozone values from beginning of ozone season
- Running list of sites with exceedances from beginning of season
- Monthly number of exceedances
- Daily maximum average eight-hour concentration for each site from beginning of season
- Map of Missouri's ozone monitoring sites
Additional information about Ozone State Planning efforts
Technical issues can affect ability to deliver quality data. Access a table of symbols with explanation of the problems they represent.
- Ozone data in third and fourth columns on each day's first page
- "P" stands for primary monitor
- "S" stands for secondary monitor
- Data from 10 days ago through current date
Fine Particulate Matter (PM 2.5)
The primary National Ambient Air Quality Standards (NAAQS), based on health effects, for fine particulate matter smaller than 2.5 micrometers in diameter, PM2.5, is 35 micrograms per cubic meter of air (μg/m3) averaged over 24 hours (98th percentile, averaged over three years) and 12 μg/m3 annual average (averaged over three years).
*All times listed in reports reflect Central Standard Time (CST).
- Annual PM2.5 design values
- 24-Hour PM2.5 design values
- Map of Missouri's PM2.5 monitoring sites
- Additional information about Particulate Matter State Planning efforts
Technical issues can affect ability to deliver quality data. Access a table of symbols with explanation of the problems they represent.
- PM2.5 data in eighth column on each day's first page
- Data from 10 days ago through current date
Particulate Matter (PM 10)
The primary National Ambient Air Quality Standard (NAAQS), based on health effects, for particulate matter smaller than 10 micrometers, PM10, is 150 micrograms per cubic meter of air (μg/m3) averaged over 24 hours — not to be exceeded more than once per year on average over three years.
*All times listed in reports reflect Central Standard Time (CST).
- Information about standard and monitoring
- Expected number of exceedance days in a year
- Map of Missouri's PM10 monitoring sites
- Additional information about Particulate Matter State Planning efforts
Technical issues can affect ability to deliver quality data. Access a table of symbols with explanation of the problems they represent.
- PM10 data in first column on each day's second page
- Data from 10 days ago through current date
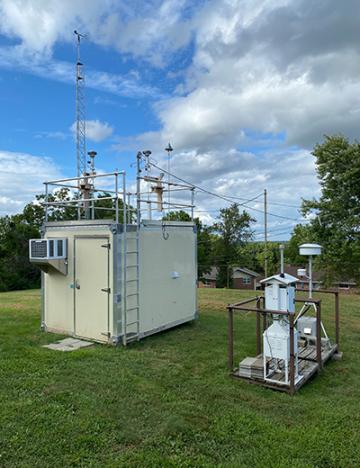
1709 Lonedell Drive
Arnold West, MO 63010
United States
Air Pollution Control Program
Division of Environmental Quality
P.O. Box 176
Jefferson City, MO 65102-0176
United States