
The Spring River originates along the Barry-Lawrence county line, south of Verona, and flows west-northeast to its confluence with the North Fork of the Spring River and then southwest into Kansas and Grand Lake of the Cherokees in Oklahoma. The Spring River delivers approximately 32% of the inflow into Grand Lake, a major drinking water source and recreational economic driver in Oklahoma. The majority of the Spring River watershed, which encompasses 1,453,440 acres, is located in the southwest corner of Missouri, and extends into Kansas and a small part of Oklahoma. For our purposes here, we will only be discussing the portion of the watershed that lies in Missouri. This portion of the watershed covers parts of Barry, Barton, Dade, Jasper, Lawrence and Newton counties, with only very small portion overlapping into Christian County. The Spring 8-digit Hydrologic Unit Code (HUC8) subbasin (HUC #11070207) is divided into ten smaller HUC10 watersheds and 56 HUC12 subwatersheds.
Cropland is the main land use in the northern third of the watershed, typically located along creeks and streams. Grasslands are the primary land use in the southern portion of the watershed. Forested land (including riparian buffers) is interspersed throughout the entire watershed. The main urban area is Joplin, a city of approximately 50,000 residents. Land use breaks down as follows: grassland/pasture/hay (52%), forest (20%), cropland (19%), developed (9%), and water and wetland (12%). There is also an extensive mining history in the watershed.
Water Quality Issues
Each land use type tends to contribute to different water quality concerns or benefits in the watershed. Several waterbodies in the Spring River subbasin are included on the state's 303(d) list as impaired, most listing nonpoint source pollution as the source of the impairment.
- Sediment impairment in the North Fork Spring River
- Bacteria impairments (E. coli) in the Baynham Branch, Capps Creek, Center Creek, Dry Fork, Hickory Creek, Honey Creek, Jenkins Creek, Jones Creek, North Fork Spring River, Shoal Creek, Slater Branch, Spring River, Thurman Creek, Truitt Creek, Turkey Creek, White Oak Creek, and Williams Creek Subwatersheds
- Nutrient impairments in Clear Creek, North Fork Spring River and Lamar Lake
- Metal impairments (cadmium, lead, zinc) in Center Creek, Shoal Creek, Shoal Creek tributary, Turkey Creek and Turkey Creek tributary
The North Fork Spring River Sediment Total Maximum Daily Load (TMDL) was approved in 2006, to address sediment due to agricultural nonpoint sources in the water. Several TMDLs have also been approved for different waterbodies in the Spring River watershed to address E.coli, nutrient and metal impairments.
Watershed Management Plan
In 2015, Kansas State University, in collaboration with the Missouri Department of Natural Resources, University of Missouri Extension and the Harry S. Truman Coordinating Council, developed a Spring River Nonpoint Source Watershed Plan. For the purposes of this plan, only the portion of the watershed that lies in Missouri will be covered. Kansas developed a separate watershed plan for its portion of the Spring River watershed. This project helps address water quality and quality of life concerns in the watershed by implementing practices to address water quality impairments and concerns in the watershed as prescribed in the watershed based plan.
Project Goals
The goals of the Spring River watershed plan are to:
- Restore impaired surface waters impacted by nonpoint source pollution
- Guide future implementation of voluntary conservation practices funded by Missouri’s nonpoint source pollution program (§319)
- Provide direction for multiple agencies and programs working to address water quality issues in the Spring River watershed
The objectives of the Spring River watershed plan are to:
- Reduce pollution loading into waterbodies that are designated as impaired through either the state’s §303(d) list or through establishing total maximum daily load (TMDLs)
- Achieve applicable water quality standards for all impaired waterbodies in 20 years
- Restore and maintain designated uses for impaired waterbodies
Below is a summary of the anticipated load reductions or removal efficiencies that will be obtained by installing the Best Management Practices (BMPs) as provided in the Spring River watershed-based plan.
- Cropland BMPs: Estimated reduction in sediment: 2,020 tons per year, total Phosphorus: 9,021 pounds per year, total Nitrogen: 22,432 pounds per year
- Livestock BMPs: Estimated reduction in total Phosphorus: 340 pounds per year, total Nitrogen: 1,162 pounds per year
- Streambank BMPs: Estimated reduction in sediment: 600 tons per year
The required sediment load reduction is 2,737 tons. If all BMPs are implemented and installed, the sediment load reduction will be met in 11 years. The required phosphorus load reduction is 230,758 pounds. If all BMPs are implemented and installed, the phosphorus load reduction will be met in 20 years.
Best Management Practices
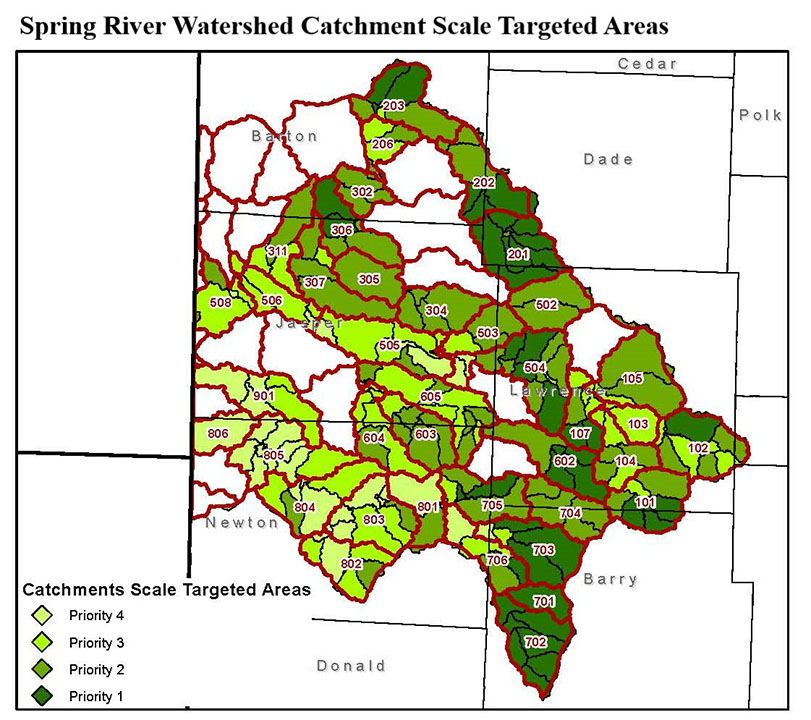
The goals and objectives of this plan will be achieved mainly through implementing conservation practices in designated priority areas. The implemented practices that are outlined in this plan are voluntary and not intended to be used for regulating farmers, ranchers or landowners. Below is a summary of practices and the anticipated adoption rate as provided in the Spring River watershed plan.
- Cropland BMPs (Target output: Adoption rate - 6,768 treated acres per year): No‐till, cover crops, nutrient management, crop rotations, grassed waterways, terraces, vegetative buffers and water retention structures
- Livestock BMPs (Target output: Adoption rate - 34 per year): off stream watering systems, rotational grazing, relocate pasture feeding sites, grazing management plans, relocate feeding pens, fence off streams and ponds
- Streambank BMPs (Target output: Implementation rate - 300 feet per year): streambank stabilization