Groundwater levels change for many reasons. Some changes are due to natural phenomena, and others are caused by man’s activities. Missouri has many different aquifers. Some are relatively shallow unconfined aquifers that are affected by surface activities. Others are much deeper confined aquifers that are well isolated from surface or shallow subsurface influences. Some aquifers consist of competent bedrock units; others are composed of unconsolidated sediments. Some aquifers are heavily used for water supply while others receive very little use. All of these factors can influence how water levels in the aquifers change over time.
All of the observation wells record a water level every 30 minutes. The data graphs show depth to water below land surface plotted on the vertical axis, and time plotted on the horizontal axis. Water level is provided to USGS and they serve the data from the National Water Information System. The “real time” data category will automatically display the last seven days of 30-minute data. Data can be viewed in the 30-minute increments, or as a single daily average.
Water-level changes can be divided into several categories. Short-term changes can be seen only when water-level measurements are made many times a day. Long-term changes can be seen only after data are collected for many years. Minor changes of only a few hundredths of a foot, and changes that are hundreds of feet can be observed. Fluctuations are generally due to one of three major factors including a change in the volume of water stored in the aquifer, changes in atmospheric pressure, and changes caused by aquifer deformation.
Fluctuations Due to Aquifer Storage Changes
Groundwater is not static. It is part of a dynamic flow system. It moves into and through aquifers from areas of high water-level elevation to areas of low water-level elevation. Groundwater-level fluctuations due to aquifer storage changes involve either the addition or extraction of water from the aquifer, both through natural means and human involvement.
Groundwater recharge occurs naturally where the earth materials are sufficiently permeable to allow water to move downward through them. Recharge occurs most easily in unconfined aquifers where water provided by precipitation moves downward from land surface until the water reaches the water table. The water table is the boundary between the unsaturated zone above it where the pore spaces are not filled with water, and the saturated zone below it where essentially all of the interconnected pore spaces are filled with water. When recharge occurs in an unconfined aquifer, the water table rises to a higher elevation, much like water level in a bucket will rise as water is added. One inch of precipitation moving underground to the water table will cause the groundwater level to rise considerably more than an inch. This is because unlike a bucket, most of the volume of an aquifer is occupied by rock, sand or other solid geologic material. The water can only occupy the void or pore spaces. For example, an aquifer with a porosity of 5% will theoretically experience a water-level rise of 20 inches due to 1 inch of recharge.
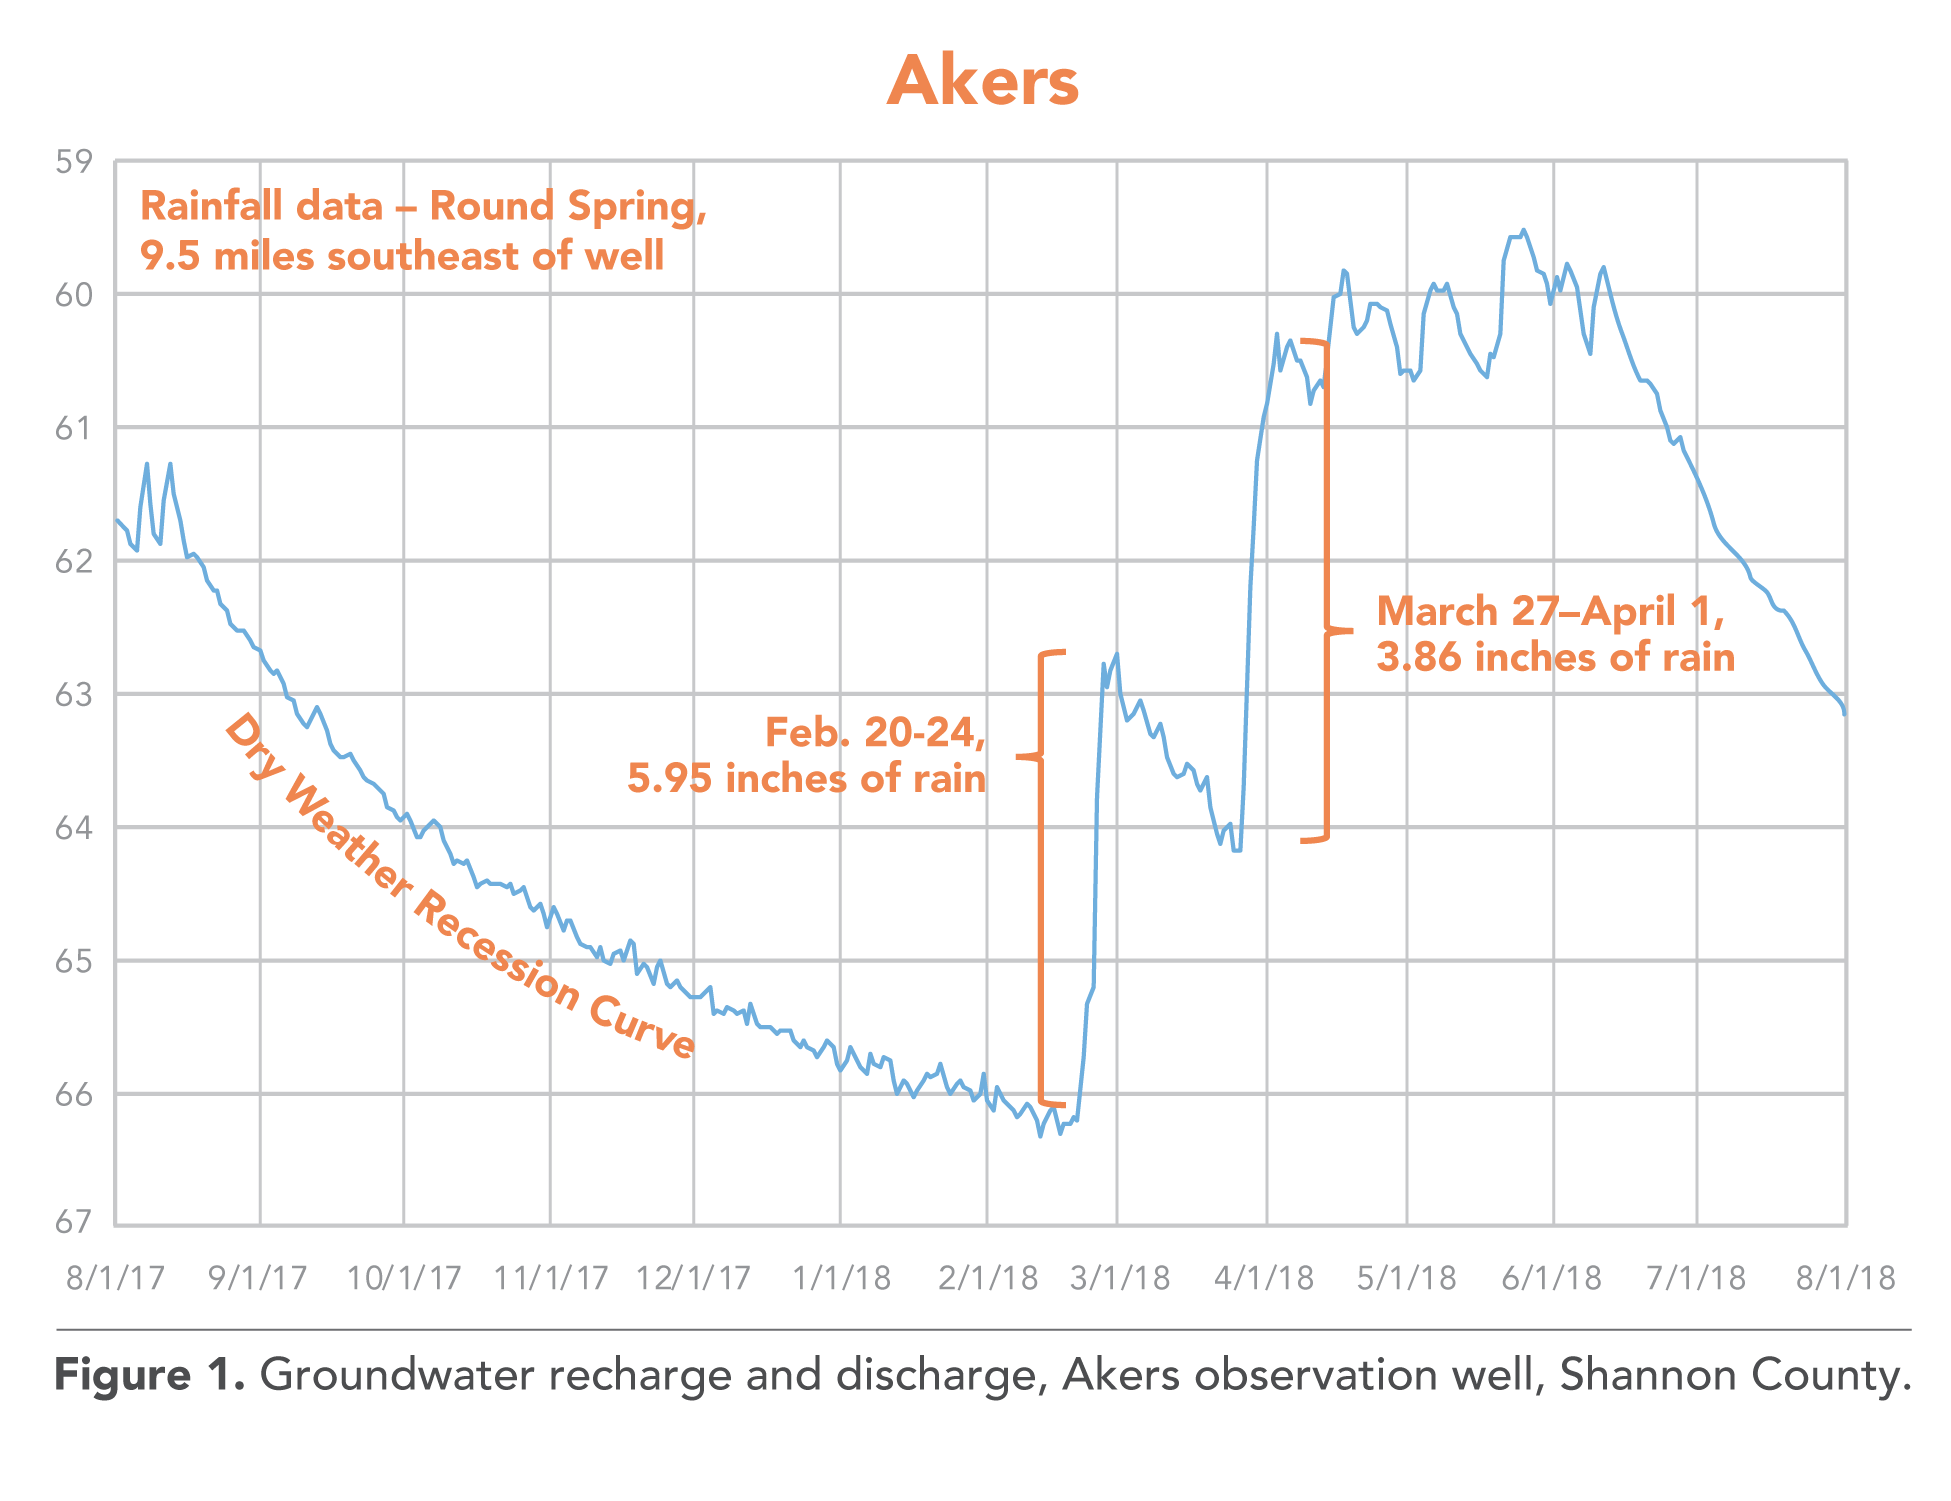
The most significant water-level changes due to recharge generally occur during springtime of the year when precipitation is generally greatest and evaporation and plant usage rates are low. Several wells in the observation well network show water-level increases due to rapid groundwater recharge following significant precipitation events. These include Halfway, Akers, Fairview and Big Spring observation wells. They are relatively shallow wells with modest lengths of casing that were drilled into unconfined aquifers. Figure 1 shows the hydrograph of the Akers observation well for one year. The vertical rises between late February and June 2018, are recharge from rainfall events at those times.
Groundwater levels in many of these same wells will show a steady decline between spring and fall, especially during dry years. This is because there is little recharge to the aquifers during those months. However, groundwater continues to move through the aquifers to supply springs and streams in the area. The water lost from storage to the springs and streams provides stream flow even during the driest years, but also causes a decline in groundwater level. Water level declines are usually greatest in the upland recharge areas where groundwater levels are typically at a higher elevation. Groundwater levels at lower elevations near valley bottoms, which are groundwater discharge areas, generally show much less change. The Akers observation well in Figures 1 also shows the effects of groundwater discharging from the Ozark Aquifer in that area during dry weather. The steady drop in water level from August 2017 to late February 2018, is the result of water discharging from the aquifer to feed local streams and springs that was not replaced by recharge.
The West Plains well also shows water level rises following precipitation (Figure 2). This well was drilled and cased much deeper than others. It is in an area of south-central Missouri where the soluble dolomite bedrock has been extensively dissolved, creating numerous karst features such as sinkholes, losing streams, springs and caves. Recharge through sinkholes, losing streams and the deeply weathered bedrock allows water from the surface to rapidly move downward into the aquifer and circulate to substantial depths. At West Plains, rainfall events of several inches can cause groundwater levels to rise more than 150 feet within a few days.

Several observation wells show the effects of recharge in a much more subtle manner. Both the Shelbina and Vandike Farms observation wells measure water-level changes in the shallow glacial drift aquifer in northeast Missouri. There is very little groundwater use in the vicinity of these two wells, so changes in water levels in these wells are almost entirely due to natural phenomena. In most years, water levels in the two wells rise during late winter and spring months, then decline through summer and fall. The seasonal cycles are clearly due to recharge and discharge of the aquifer, but because the movement of groundwater in these areas is much slower than in the Ozarks region, water level changes are correspondingly slow.
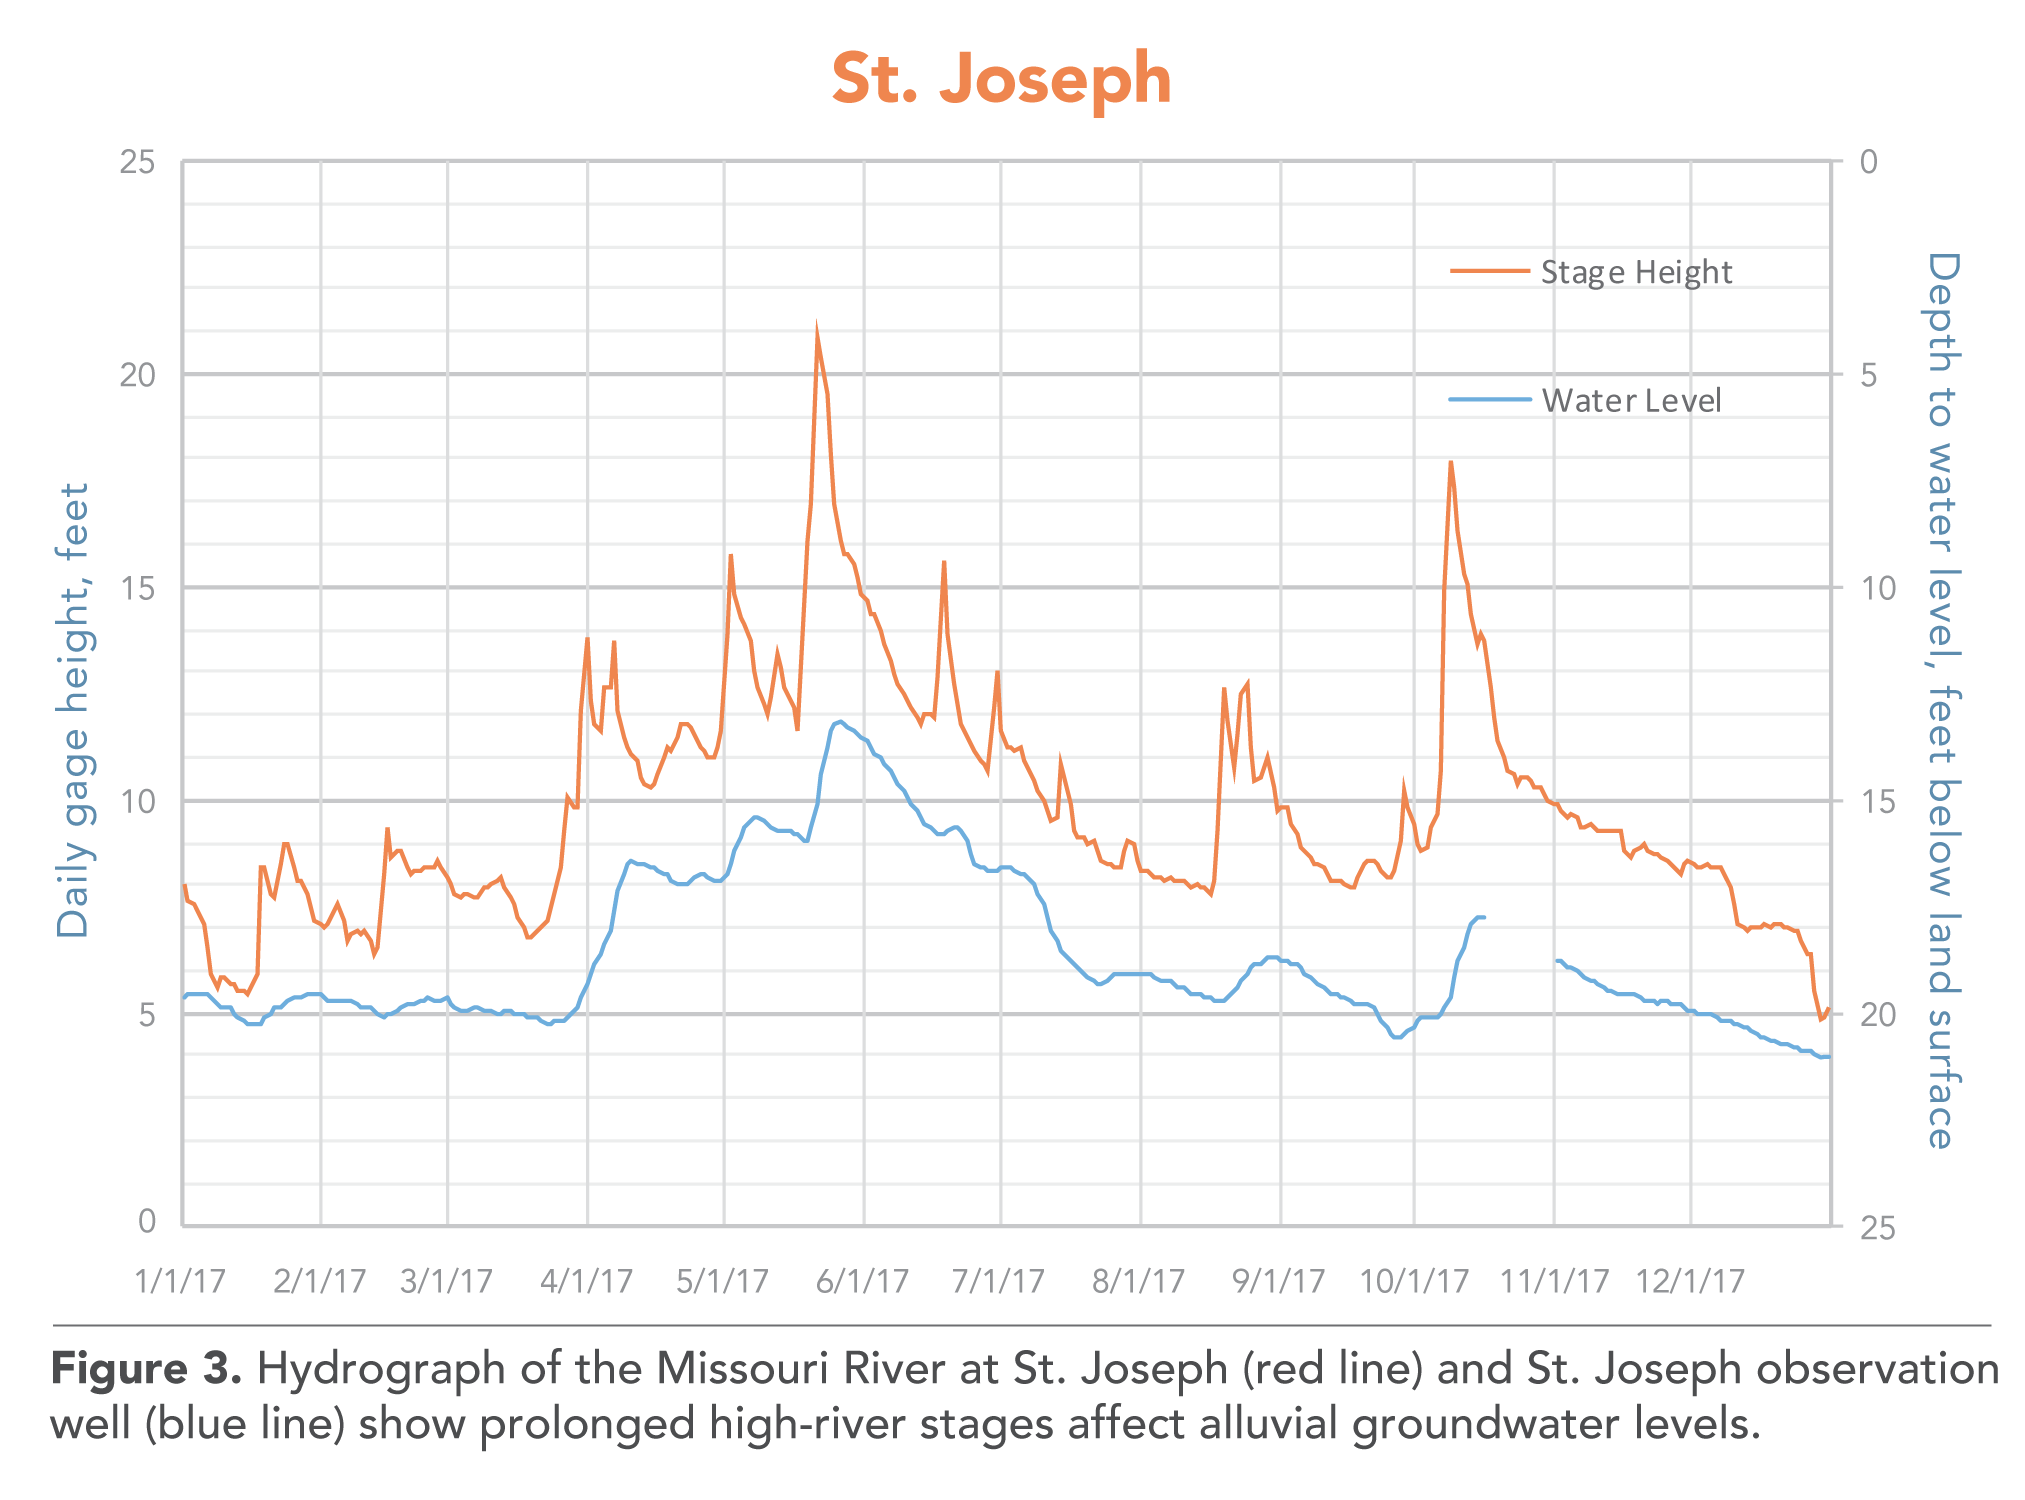
Rainfall is not the only source of groundwater recharge. Alluvial aquifers that underlie river floodplains are partly recharged by rivers during high-flow stages. When the water level of the river is at an elevation higher than the groundwater level, water will move from the river into the alluvial aquifer. When the river level is lower than that of the groundwater, water flows from the aquifer back into the stream. Wells near the river will show the response more quickly than wells farther away. Figure 3 shows the stage of the Missouri River at St. Joseph during 2017, and groundwater levels at the St. Joseph observation well, which is completed into the Missouri River Alluvial Aquifer. The well is about 4,000 feet from the Missouri River. Note how prolonged rises in river stage cause water level in the alluvial aquifer to also rise.
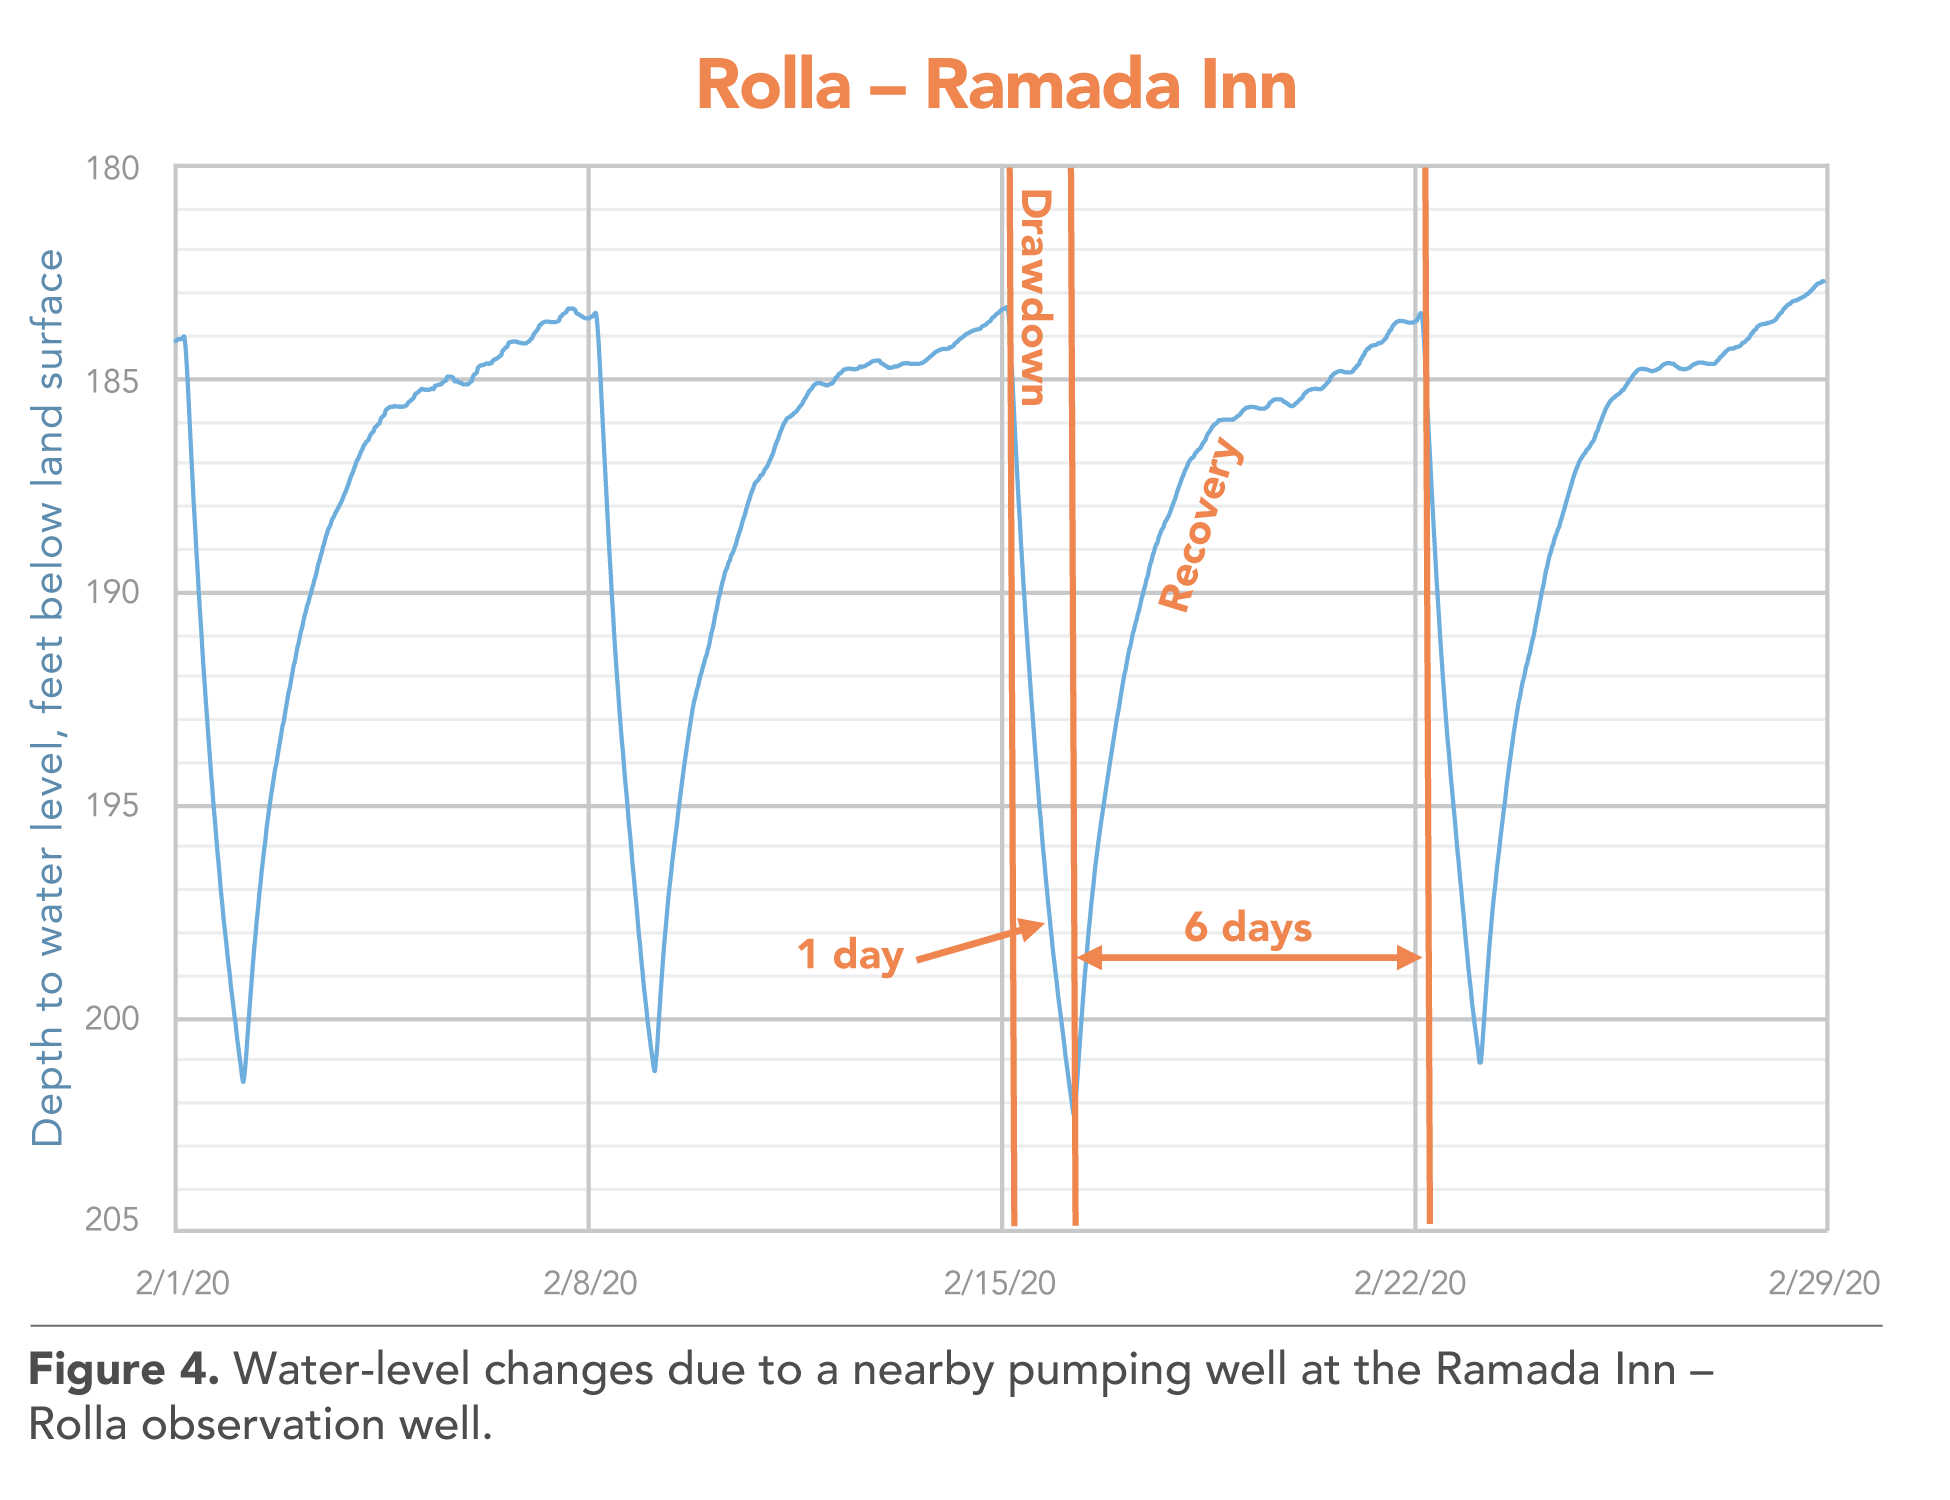
Water level rises and falls can also be caused by water wells producing groundwater in the vicinity of the observation wells. Many observation wells, especially those originally used as municipal water supply wells, show water-level changes that reflect municipal water use. Most cities and towns use considerably more water during the summer months than other times of the year, so it is normal to see groundwater levels drop then and recover during the off-peak times of the year. Several observation wells are very close to active producing wells. The Rolla Ramada Inn observation well was drilled as municipal water-supply well and much later configured to collect water-level information. It is very close to operating municipal wells. The rapid water-level fluctuations it records is due to the pumps cycling on and off at the nearby producing wells (Figure 4). The Rolla Ramada Inn observation well also shows a pronounced drawdown-recovery cycle pattern. The hydrograph shows how a nearby Rolla municipal well affects water level in the observation well. When the data were collected, the municipal well (one of 17 wells serving Rolla), experienced a seven-day cycle with about one-day of pumping followed by six days of recovery.
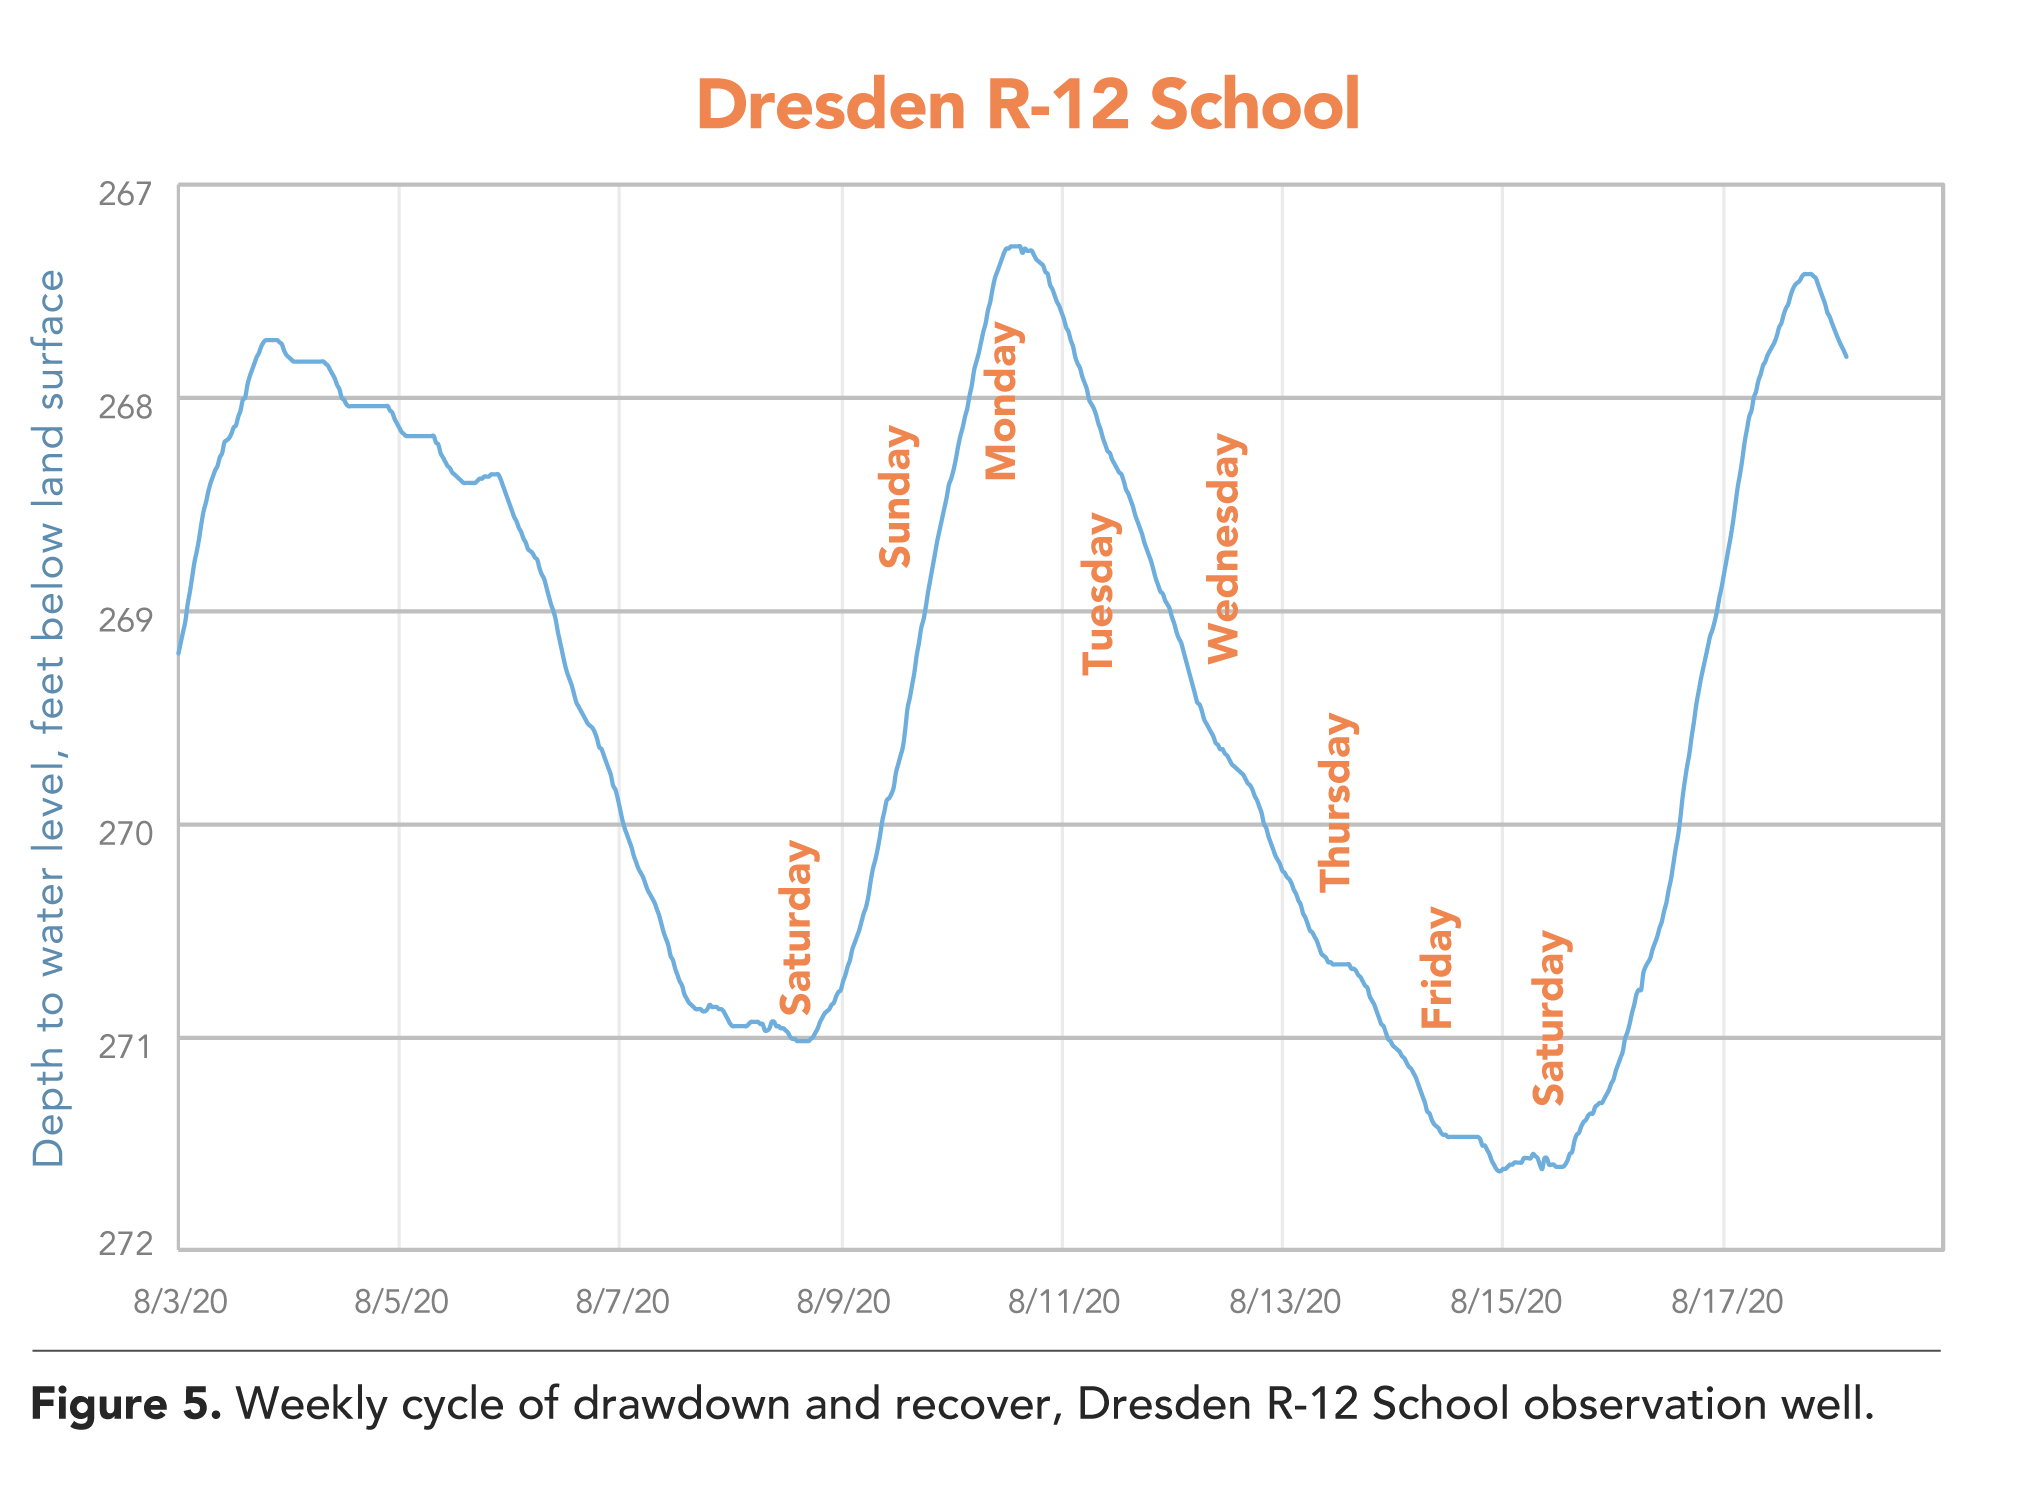
Several wells are strongly influenced by nearby industrial pumping. Industrial water usage is often closely tied to the workweek. The Dresden School observation well (Figure 5) is near major industrial water user. Water levels in the well typically are highest on Mondays and lowest early Saturday. Water use on weekends is much less than during the week, allowing water levels to recover somewhat until the following Monday morning when the pumping cycle starts again.
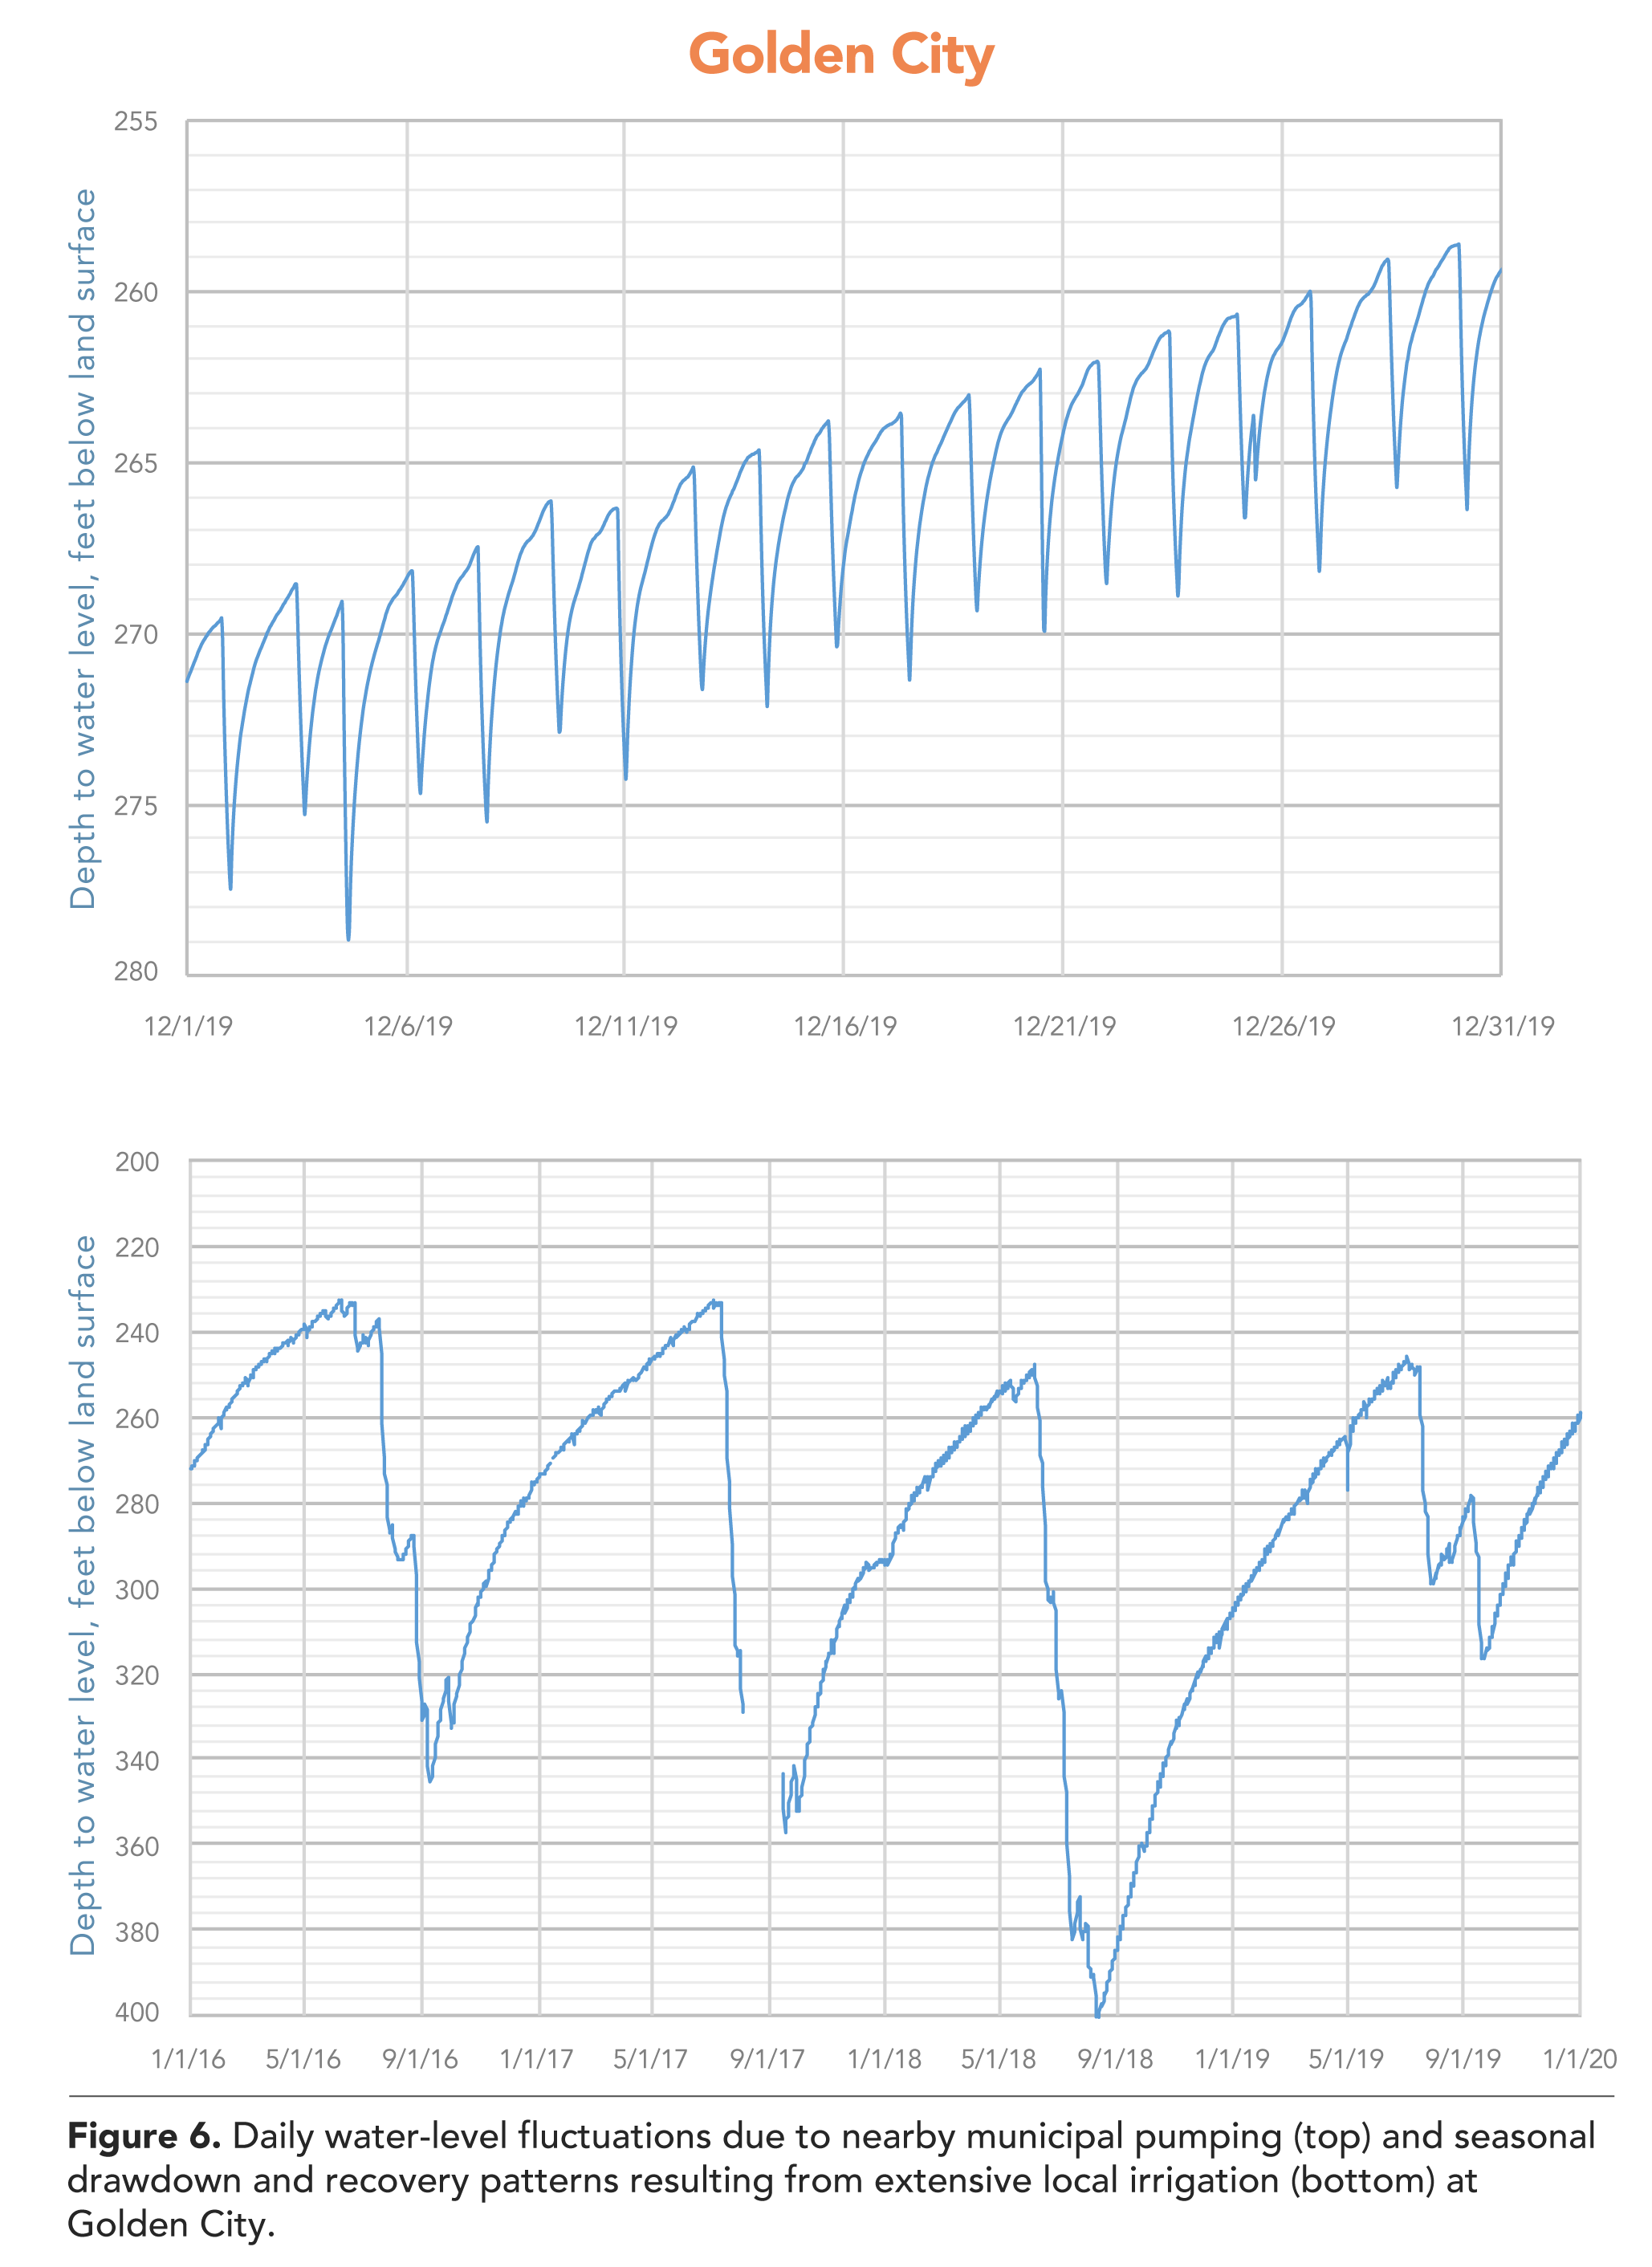
Longer-term pumping cycles affect several observation wells. Water levels in the Golden City observation well is mostly affected by agricultural irrigation. The irrigation season in southwest Missouri typically begins in early July and ends in mid-September. Between late September and early July, the Golden City observation well shows about 6 to 8 feet of fluctuation due to pumping at the city’s other wells. However, groundwater levels in the Ozark Aquifer in that area drops sharply during the irrigation season, then slowly recovers the remainder of the year (Figure 6).
Two adjacent observation wells (Valley Water Mills in Springfield) independently monitor one of two primary aquifers. The deeper Ozark Aquifer is used by several high-yield municipal and industrial wells. Water levels in the observation well can drop as much as 80 feet due to continuous pumping. After pumping stops, the aquifer recovers as rapidly as it was dewatered. The Springfield Plateau Aquifer is shallower and is not typically used as a water source, due to potential contamination. While water levels in the Springfield Plateau Aquifer observation well do fluctuate, the water level has not changed more than 8 feet since 2014 (Figure 7).

A few of the observation wells have recorded long-term water-level declines that are due to groundwater use. Long-term hydrographs at Noel, Golden City, Lamar, New Florence, Sedalia and Rolla (Ramada Inn), show long-term declines of from less than 50 feet to as much as 400 feet. Conversely, the Festus observation well shows just the opposite. Depth-to-water at Festus was about 275 feet in 2000 when the well was equipped with recording equipment. Presently, groundwater level in the observation well averages about 75 feet below land surface. The recovery in groundwater level in that area is due to a change in water supply sources. Much of the water formerly supplied by numerous deep wells producing from the Ozark Aquifer is now supplied by surface water piped south out of St. Louis County into northern Jefferson County, and installation of a high capacity collector well in the Mississippi River alluvium at Festus. Other wells showing long-term groundwater rise include Cassville, Monett and Osceola.
Fluctuations Due to Atmospheric Pressure Changes
Rainfall is not the only weather factor that can affect groundwater levels. Changes in atmospheric pressure can also cause groundwater levels to fluctuate. Atmospheric pressure is caused by the Earth’s gravitational attraction of air in the atmosphere. At sea level, the weight of the atmosphere exerts a pressure of about 14.7 pounds per square inch on the Earth’s surface which is equivalent to the pressure exerted by a column of mercury that is 29.92 inches high.
According to the National Weather Service office in Springfield, barometric pressure in that area is typically between 29.6 and 30.2 inches of mercury, but can be higher or lower during unusual weather conditions. Between January 2015 and September 2020, barometric pressure measured at Sanborn Field, University of Missouri-Columbia, varied between 29.15 inches and 30.95 inches of mercury.
Changes in barometric pressure will cause water levels in some wells to change. The relationship is inverse. An increase in air pressure will cause water-level in the well to fall, and a decrease in air pressure will cause water level in the well to rise.
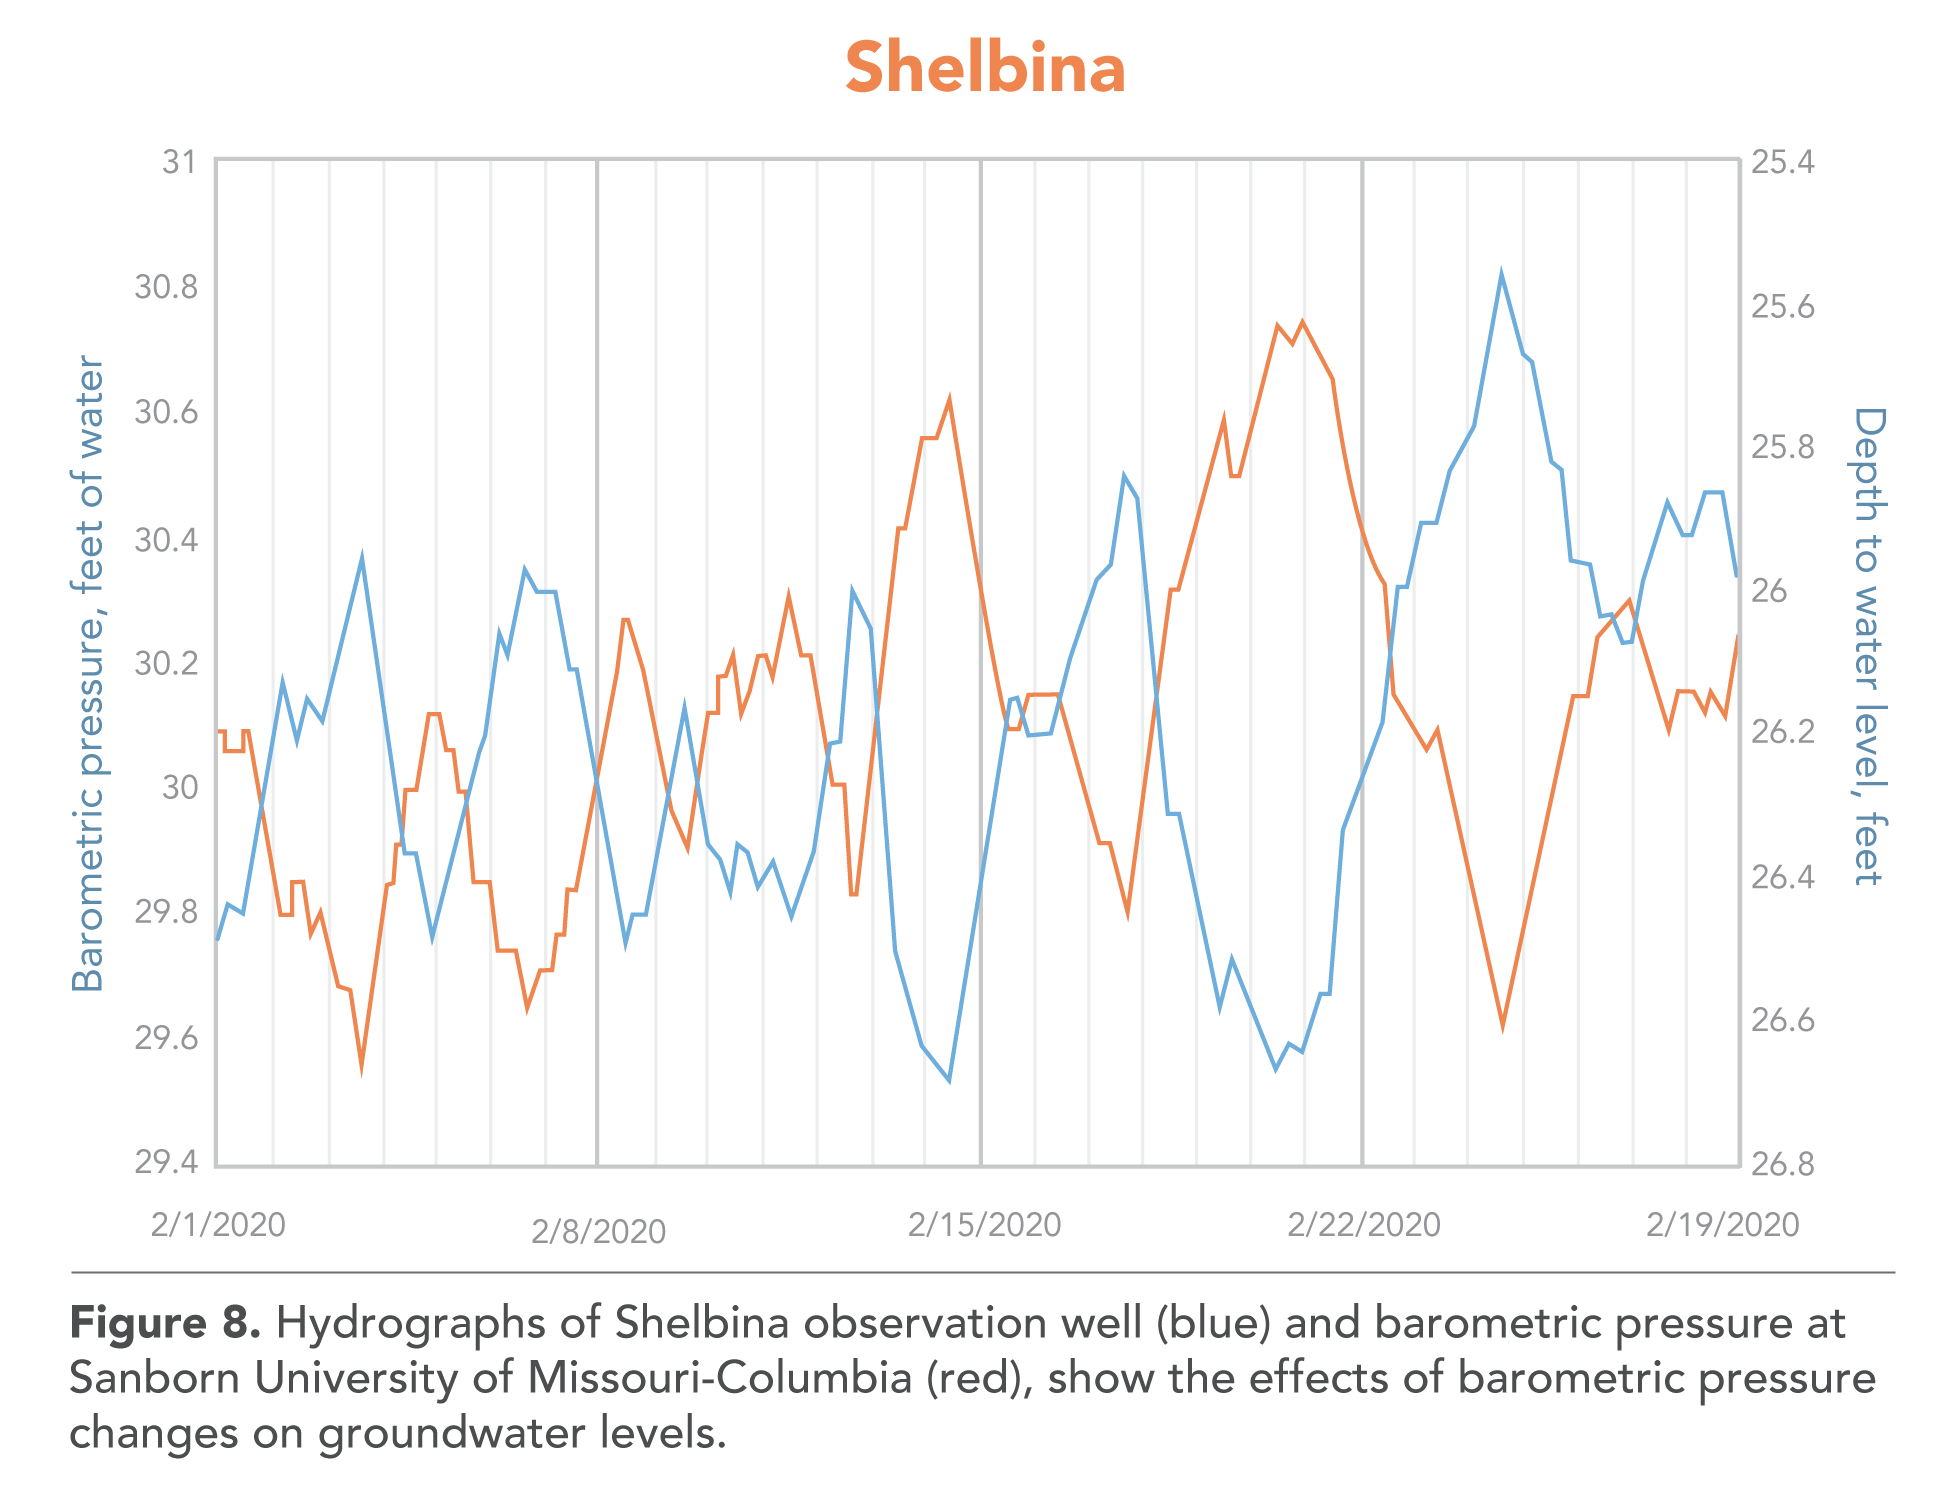
A number of wells in the observation well network clearly show barometric tendencies. Passage of a strong high or low pressure system will generally generate water-level changes of from 0.2 to more than 0.5 feet in the wells. Figure 8 shows a hydrograph for the Shelbina observation well in Shelby County. The barometric pressure measured at Sanborn Field also is shown on the graph. The inverse relationship between barometric pressure changes and water-level changes is quite clear. Many observation wells are known to show barometric effects. Some of these include Jameson, Mt. Leonard, Sedalia, Wentzville, Longview, New Florence, Osceola, Warrensburg, Desoto, Akers, Linn, Urich, Sullivan, Mexico, Lebanon and Fredericktown.
Fluctuations Due to Aquifer Deformation
Water-level changes due to aquifer deformation are commonly due to either Earth tides or earthquakes. Other external stresses caused by heavy trucks and trains can also cause groundwater fluctuations in some aquifers.
When most people think of tides, they immediately think of the change in sea level caused by gravitational attraction of the sun and moon, along with other factors. The tidal effects on groundwater, commonly called Earth tides, have nothing to do with the oceans, but are related to the gravitational effects of the sun and moon. Changes in gravitational attraction causes a slight dilation of some aquifers that temporarily changes the aquifer porosity a slight amount. Wells affected by tidal effects report two maximum and two minimum water levels daily, each of which are about six hours apart. The minimum measurements occur when the moon is either directly overhead, or on the opposite side of the planet. The strongest effects are seen at new moon, when the moon is directly between the Earth and sun, and at full moon when the Earth is between the sun and moon. At first quarter and third quarter phases, when the moon is at a right angle with respect to the Earth and sun, the cycles become very poorly defined.
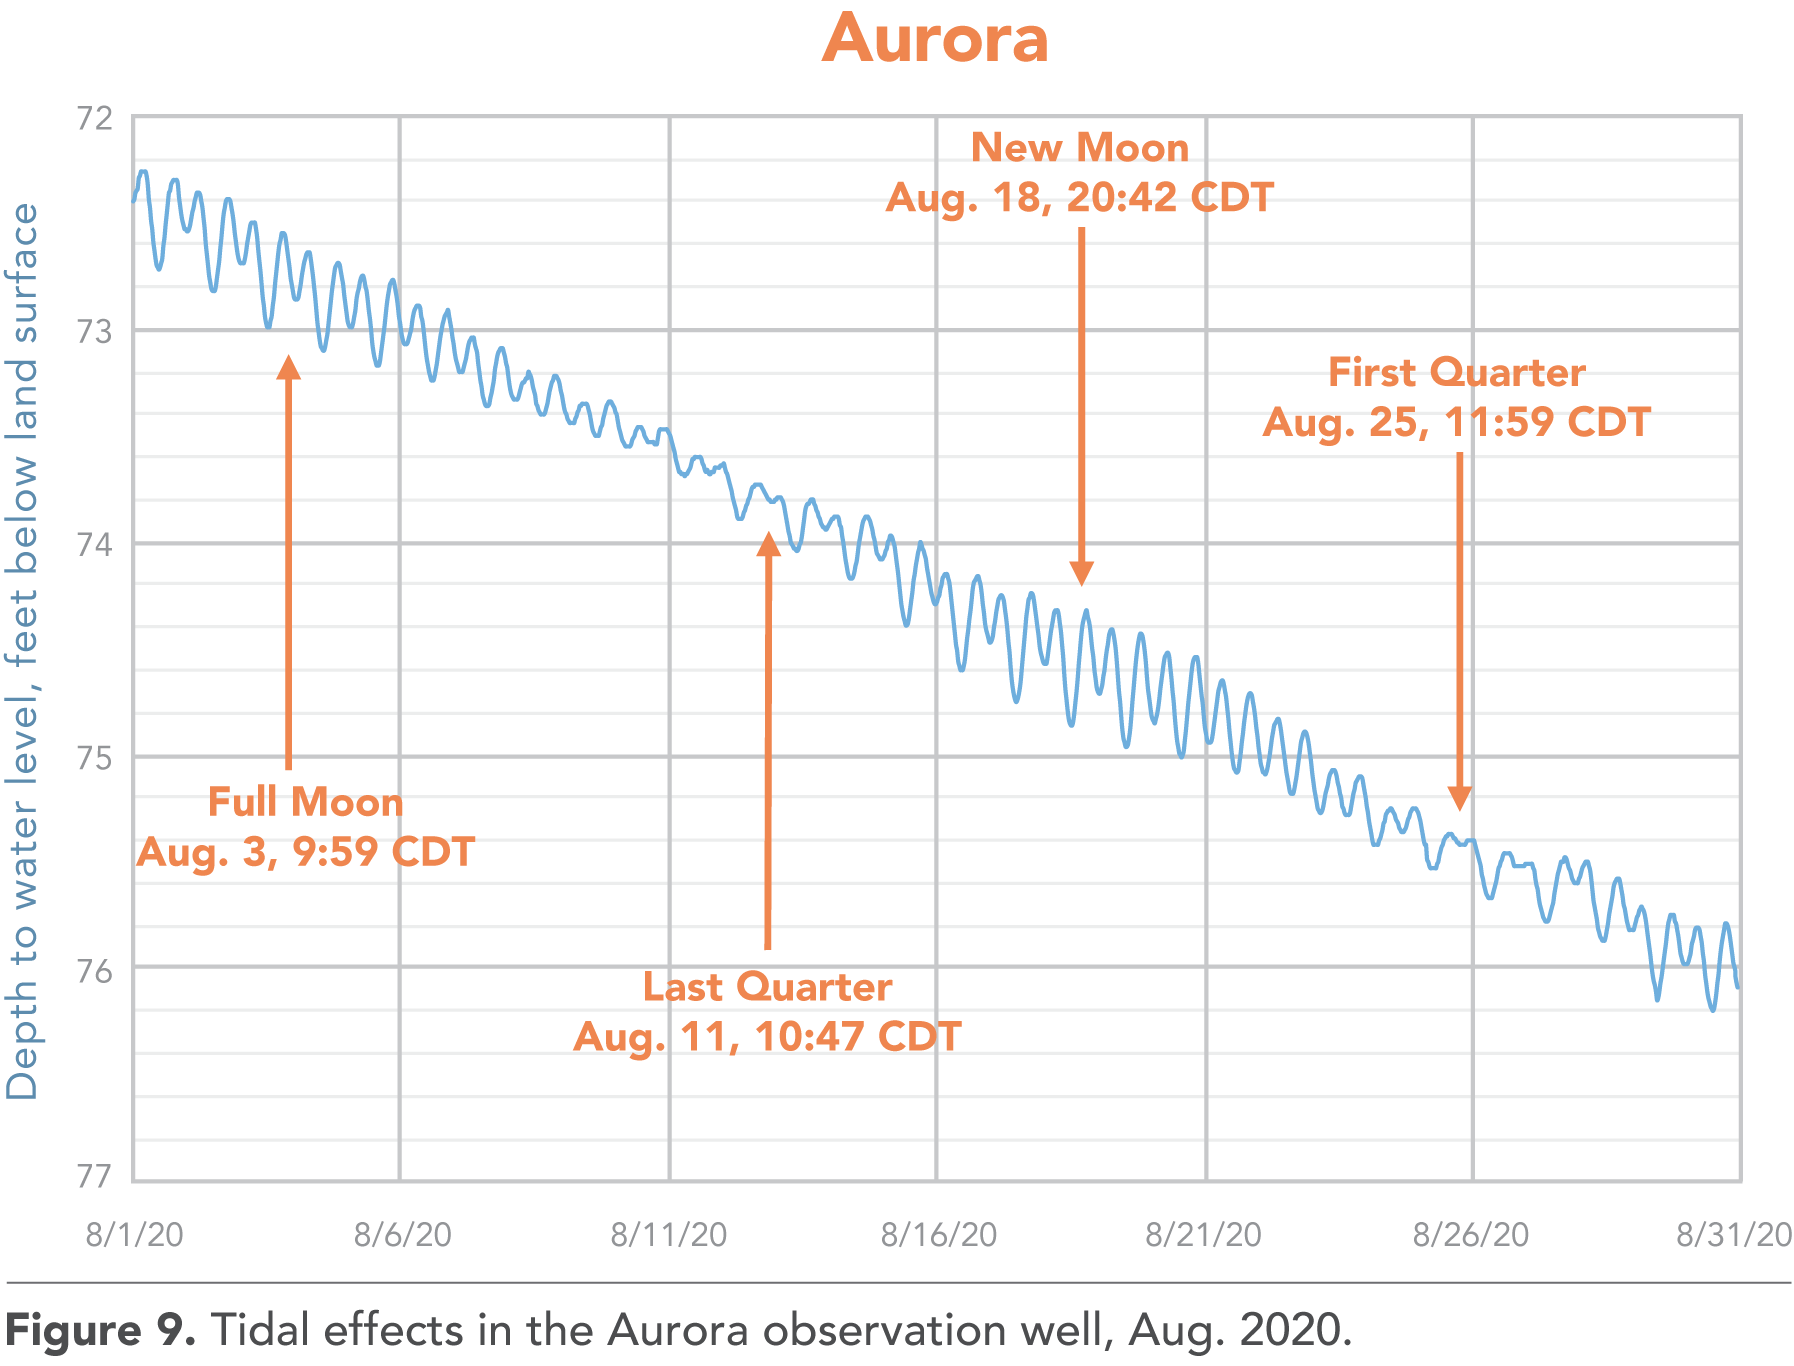
Water-level fluctuations due to tidal effects are generally small, in the range of 0.2 to 0.4 feet. Figure 9 is a hydrograph of the Aurora observation well that shows water-level changes over a month’s time. The phases of the moon are also indicated on the graph. Many of the observation wells show at least some effects of Earth tides. Some of the observation wells that commonly show tidal effects include Mexico, Lamar, Columbia, Urich, Akers, Fairview, West Plains, Aurora, Fredericktown, New Florence, Linn, Sedalia, Wentzville, St. Clair, and Drake. The graphs that best show tidal effects are generally from wells that are not influenced in other ways. Wells that ordinarily display tidal effects, but whose water levels are changing much more than a few tenths of a foot per day because of nearby pumping, groundwater recharge, etc., lose the smooth sine-wave curve characteristic of tidal effects.
Groundwater levels can be affected to a small degree (a few hundredths of a foot) by the weight of passing trucks or trains, provided they are close enough to the well. Many years ago the observation wells were equipped with graphic recorders that used paper, pen and ink to record the water-level hydrograph. Any change in the level of water more than a few thousandths of a foot was instantly recorded on the paper chart. Events like passing trains and heavy trucks are short in duration, so the hydrograph change appeared as small vertical lines just above the normal water-level line. Today, data are collected every 30 minutes, and if a passing, heavy truck or train affects the water level in the well, the likelihood for recording that change is slight. A rail line passes near the Mendon observation well. The Malden observation well is at the edge of a highway right-of-way. When a heavy vehicle passes by, the water level in the well rises a few hundredths of a foot, then it returns to its previous level. These changes usually are not reflected on the 30-minute data collection report.
Earthquakes cause some of the most dramatic stress-related groundwater-level fluctuations recorded by observation wells. Seismically induced water-level fluctuations, also called hydroseisms, are commonly observed following major earthquakes. Energy released by earthquakes travels great distances in the form of several different types of waves. Wells relatively close to a major earthquake may experience permanent water-level changes. However, the earthquake typically causes the water level in a well to fluctuate for perhaps a few minutes before returning to its normal level.
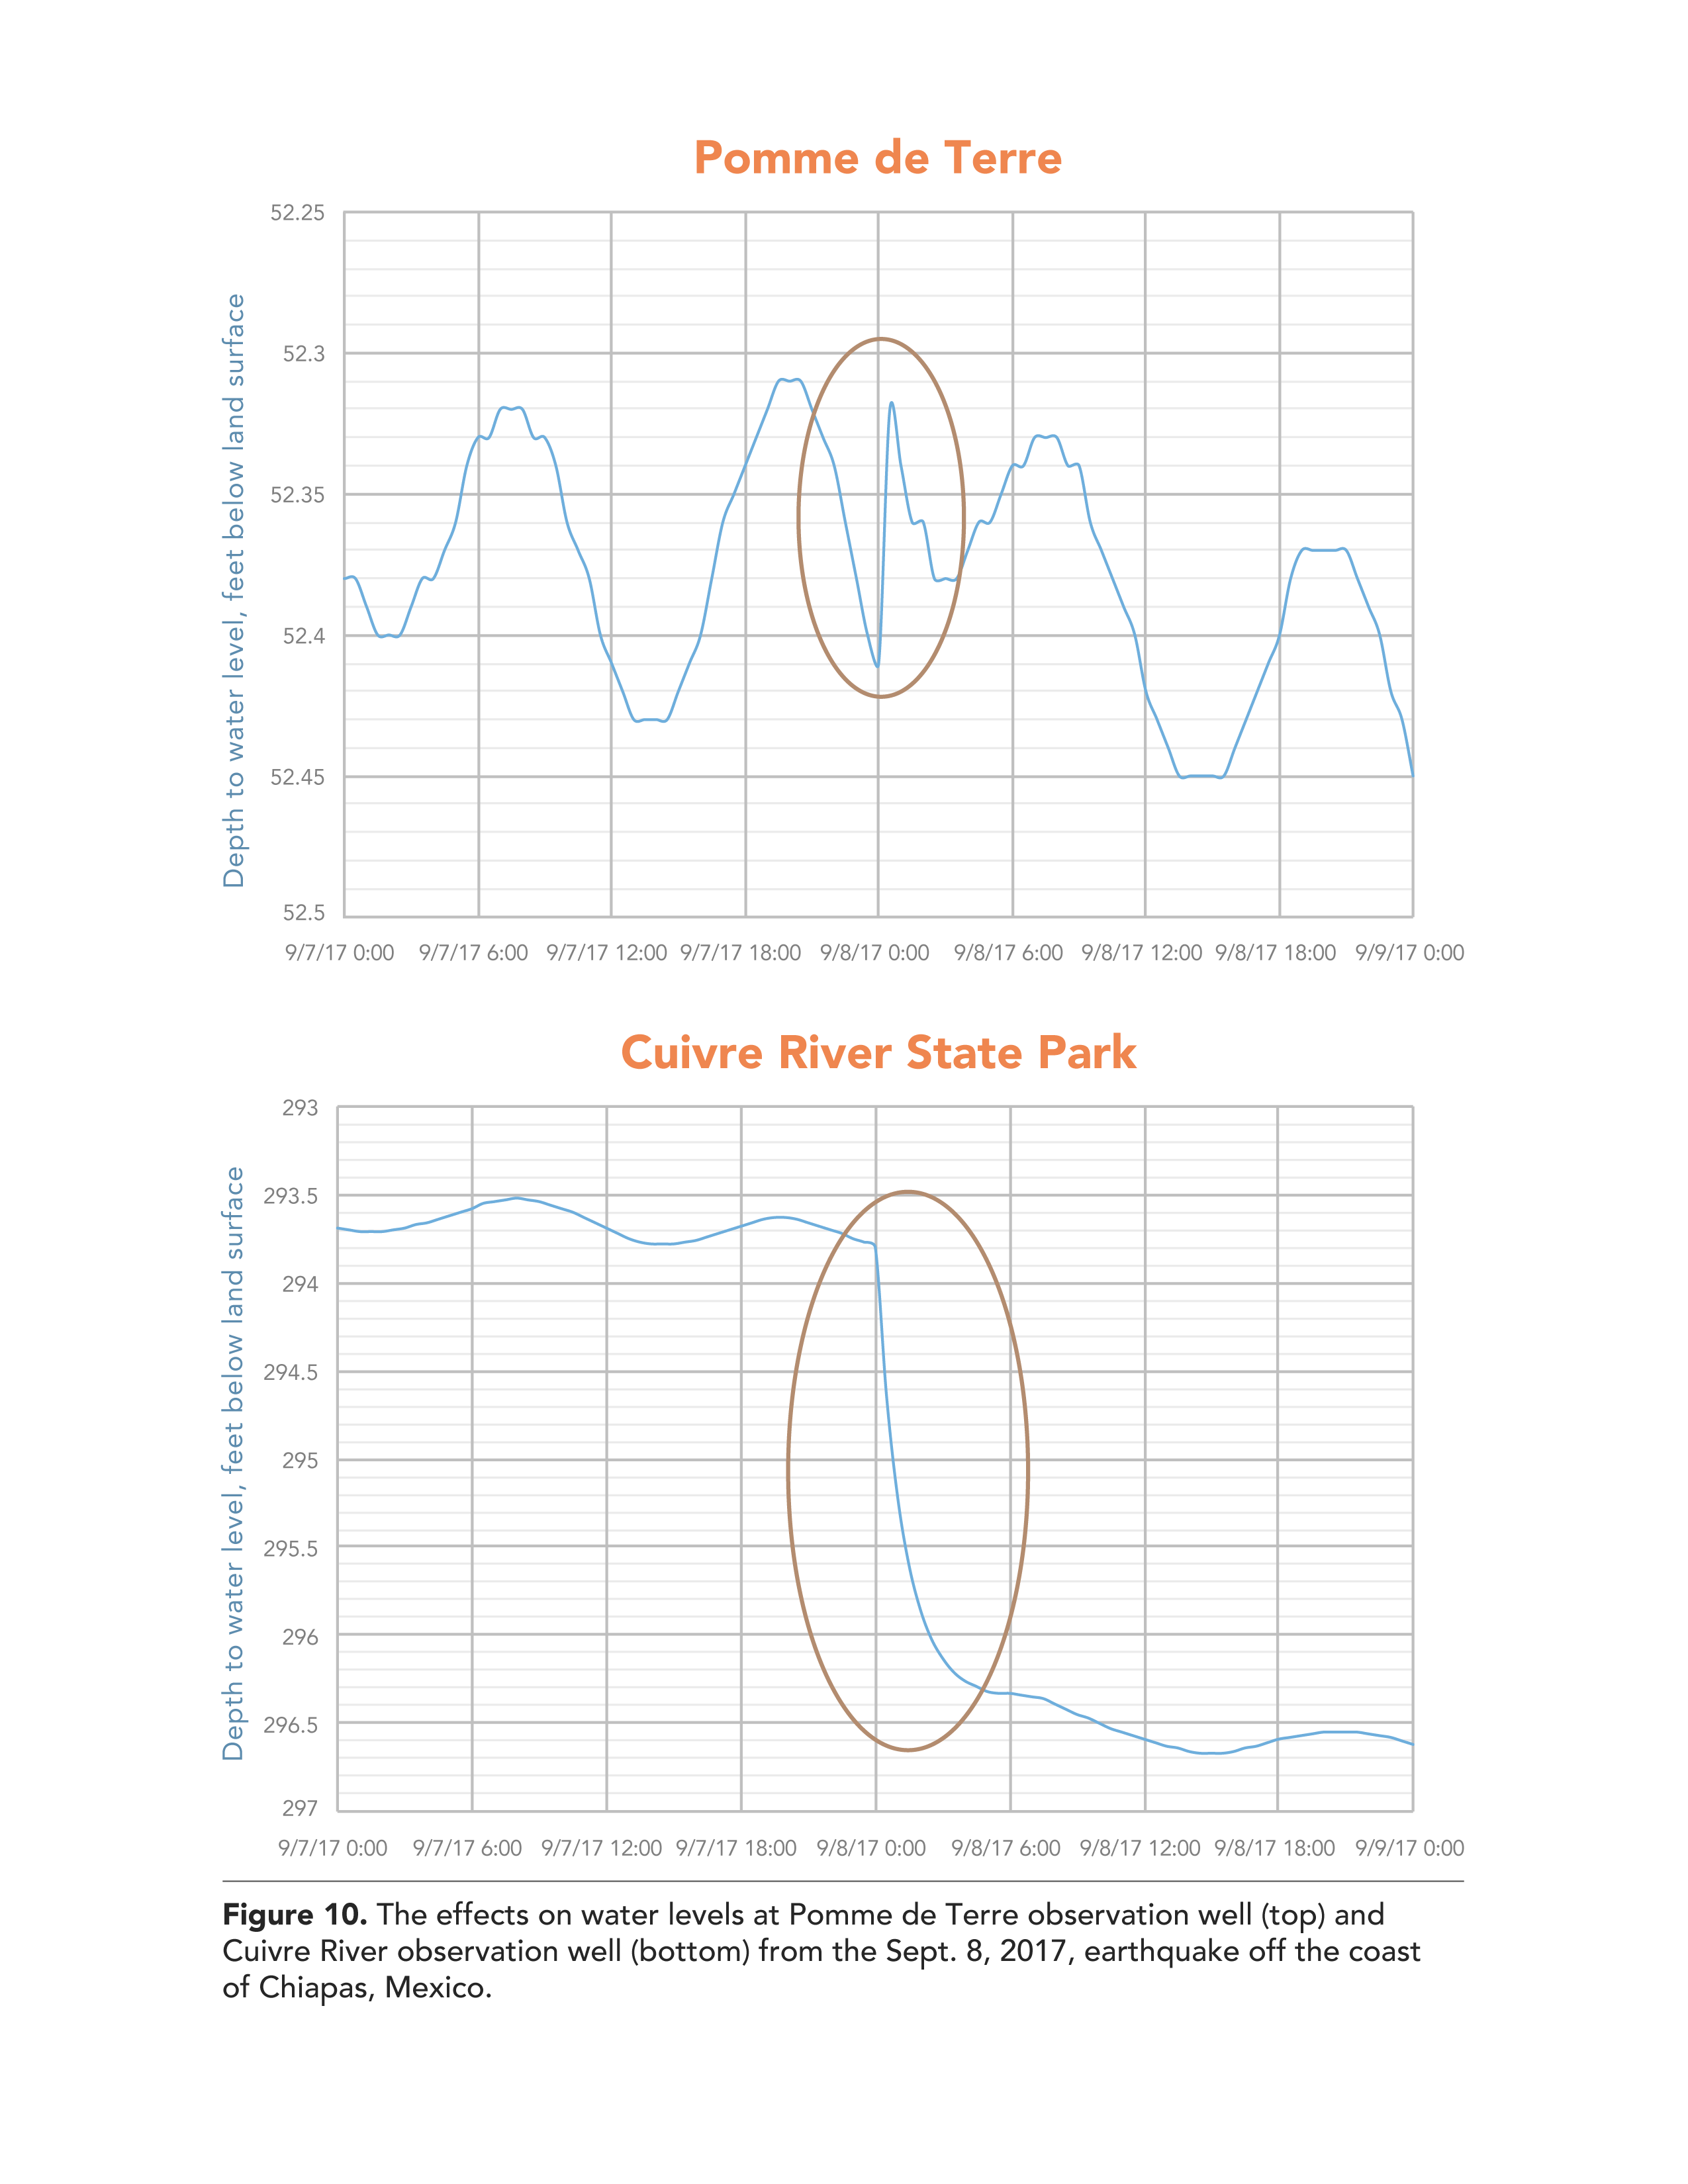
The pen and ink chart recorders previously discussed were better able to measure water-level fluctuations caused by earthquakes than the digital equipment used today. Even though the equipment currently in use records water levels every 30 minutes, many earthquakes have been observed within the observation well network. On Sept. 7, 2017, at 11:49 p.m. (CDT), a magnitude 8.1 earthquake occurred off the coast of Chiapas, Mexico. Of the 148 observation wells active at the time, 24 recorded a disturbance in the water level, caused by the seismic waves. Water levels rose in some wells, but dropped in others (Figure 10). Additionally, while some wells immediately recovered, such as at Pomme de Terre, other disturbances had a longer impact such as at Cuivre River observation well. The exact cause of this phenomenon is not entirely understood. The observation well network also recorded the Nov. 3, 2003, earthquake in Alaska and the Dec. 26, 2004, earthquake in Sumatra, Indonesia, more than 9,000 miles away.
The groundwater-level hydrograph patterns described above aid those using this information to recognize basic hydrograph shapes and to understand the factors that cause groundwater-level changes. Many wells can show multiple patterns. For example, it is not uncommon to see the tidal effects in wells that also show barometric tendencies. Other wells may show smaller tidal effects within the larger recession curves during dry periods. Precipitation, moon phases, and earthquakes all have an effect on the Akers observation well. Smaller changes are best seen on 30-minute collection interval data. Daily data best shows other effects, such as nearby water use and precipitation.